| The LOGISTIC Procedure |
| Classification Table |
For binary response data, the response is either an event or a nonevent. In PROC LOGISTIC, the response with Ordered Value 1 is regarded as the event, and the response with Ordered Value 2 is the nonevent. PROC LOGISTIC models the probability of the event. From the fitted model, a predicted event probability can be computed for each observation. A method to compute a reduced-bias estimate of the predicted probability is given in the section Predicted Probability of an Event for Classification. If the predicted event probability exceeds or equals some cutpoint value  , the observation is predicted to be an event observation; otherwise, it is predicted as a nonevent. A
  frequency table can be obtained by cross-classifying the observed and predicted responses. The CTABLE option produces this table, and the PPROB= option selects one or more cutpoints. Each cutpoint generates a classification table. If the PEVENT= option is also specified, a classification table is produced for each combination of PEVENT= and PPROB= values.
The accuracy of the classification is measured by its sensitivity (the ability to predict an event correctly) and specificity (the ability to predict a nonevent correctly). Sensitivity is the proportion of event responses that were predicted to be events. Specificity is the proportion of nonevent responses that were predicted to be nonevents. PROC LOGISTIC also computes three other conditional probabilities: false positive rate, false negative rate, and rate of correct classification. The false positive rate is the proportion of predicted event responses that were observed as nonevents. The false negative rate is the proportion of predicted nonevent responses that were observed as events. Given prior probabilities specified with the PEVENT= option, these conditional probabilities can be computed as posterior probabilities by using Bayes’ theorem.
Predicted Probability of an Event for Classification
When you classify a set of binary data, if the same observations used to fit the model are also used to estimate the classification error, the resulting error-count estimate is biased. One way of reducing the bias is to remove the binary observation to be classified from the data, reestimate the parameters of the model, and then classify the observation based on the new parameter estimates. However, it would be costly to fit the model by leaving out each observation one at a time. The LOGISTIC procedure provides a less expensive one-step approximation to the preceding parameter estimates. Let  be the MLE of the parameter vector
  based on all observations. Let
  denote the MLE computed without the
  th observation. The one-step estimate of is given by
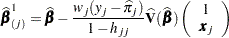 |
where

is 1 for an observed event response and 0 otherwise

is the weight of the observation

is the predicted event probability based on

is the hat diagonal element with
 and
and 

is the estimated covariance matrix of
False Positive and Negative Rates Using Bayes’ Theorem
Suppose  of
of  individuals experience an event, such as a disease. Let this group be denoted by
  , and let the group of the remaining
  individuals who do not have the disease be denoted by
  . The th individual is classified as giving a positive response if the predicted probability of disease (
 ) is large. The probability is the reduced-bias estimate based on the one-step approximation given in the preceding section. For a given cutpoint
  , the th individual is predicted to give a positive response if
  .
.
Let  denote the event that a subject has the disease, and let
  denote the event of not having the disease. Let
  denote the event that the subject responds positively, and let
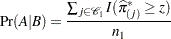
  denote the event of responding negatively. Results of the classification are represented by two conditional probabilities,
  and
and  , where is the sensitivity and is one minus the specificity.
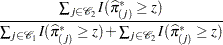
These probabilities are given by
 |
|||
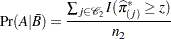 |
where  is the indicator function.
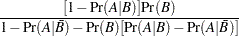
Bayes’ theorem is used to compute the error rates of the classification. For a given prior probability  of the disease, the false positive rate
  and the false negative rate
  are given by Fleiss (1981, pp. 4–5) as follows:
 |
 |
 |
|||
 |
|
 |
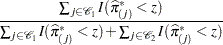
The prior probability can be specified by the PEVENT= option. If the PEVENT= option is not specified, the sample proportion of diseased individuals is used; that is,  . In such a case, the false positive rate and the false negative rate reduce to
 |
 |
 |
|||
 |
|
 |
Note that for a stratified sampling situation in which and  are chosen a priori,
  is not a desirable estimate of . For such situations, the PEVENT= option should be specified.
Copyright © SAS Institute, Inc. All Rights Reserved.