TABULATE Procedure
- Syntax

- Overview
- Concepts
- Using
- Results
- Examples Creating a Basic Two-Dimensional TableSpecifying Class Variable Combinations to Appear in a TableUsing Preloaded Formats with Class VariablesUsing Multilabel FormatsCustomizing Row and Column HeadingsSummarizing Information with the Universal Class Variable ALLEliminating Row HeadingsIndenting Row Headings and Eliminating Horizontal SeparatorsCreating Multipage TablesReporting on Multiple-Response Survey DataReporting on Multiple-Choice Survey DataCalculating Various Percentage StatisticsUsing Denominator Definitions to Display Basic Frequency Counts and PercentagesSpecifying Style Elements for ODS OutputStyle PrecedenceNOCELLMERGE Option
- References
Example 13: Using Denominator Definitions to Display Basic Frequency Counts and Percentages
| Features: |
|
| Other features: |
FORMAT procedure |
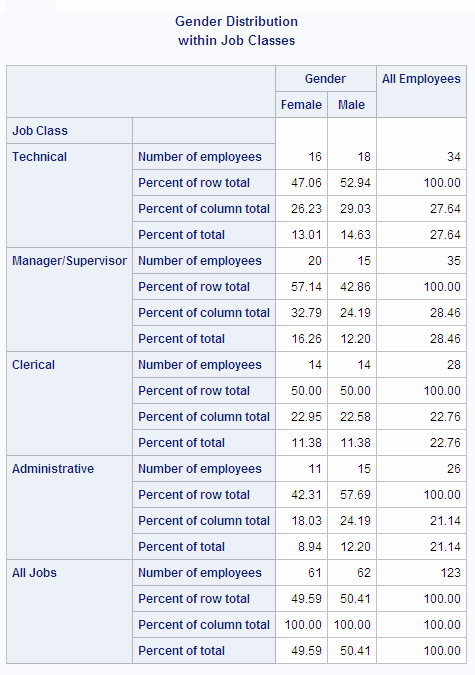
Details
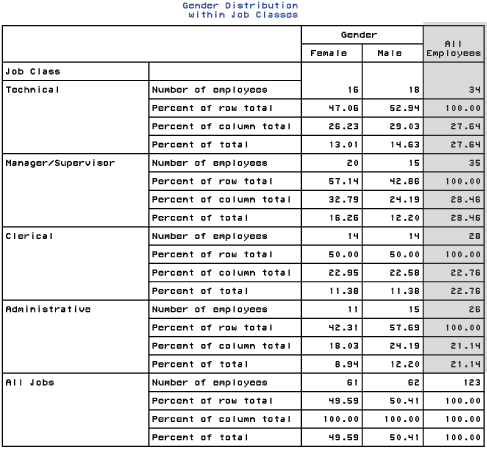
Crosstabulation tables
(also called contingency tables or stub-and-banner reports) show combined
frequency distributions for two or more variables. This table shows
frequency counts for females and males within each of four job classes.
The table also shows the percentage that each frequency count represents
the following:
Program
data jobclass;
   input Gender Occupation @@;
   datalines;
1 1  1 1  1 1  1 1  1 1  1 1  1 1
1 2  1 2  1 2  1 2  1 2  1 2  1 2
1 3  1 3  1 3  1 3  1 3  1 3  1 3
1 1  1 1  1 1  1 2  1 2  1 2  1 2
1 2  1 2  1 3  1 3  1 4  1 4  1 4
1 4  1 4  1 4  1 1  1 1  1 1  1 1
1 1  1 2  1 2  1 2  1 2  1 2  1 2
1 2  1 3  1 3  1 3  1 3  1 4  1 4
1 4  1 4  1 4  1 1  1 3  2 1  2 1
2 1  2 1  2 1  2 1  2 1  2 2  2 2
2 2  2 2  2 2  2 3  2 3  2 3  2 4
2 4  2 4  2 4  2 4  2 4  2 1  2 3
2 3  2 3  2 3  2 3  2 4  2 4  2 4
2 4  2 4  2 1  2 1  2 1  2 1  2 1
2 2  2 2  2 2  2 2  2 2  2 2  2 2
2 3  2 3  2 4  2 4  2 4  2 1  2 1
2 1  2 1  2 1  2 2  2 2  2 2  2 3
2 3  2 3  2 3  2 4
;
proc format;
   value gendfmt 1='Female'
                 2='Male'
             other='*** Data Entry Error ***';
   value occupfmt 1='Technical'
                  2='Manager/Supervisor'
                  3='Clerical'
                  4='Administrative'
              other='*** Data Entry Error ***';
run;
proc tabulate data=jobclass format=8.2;
class gender occupation;
    table (occupation='Job Class' all='All Jobs')
              *(n='Number of employees'*f=9.
              pctn<gender all>='Percent of row total'
              pctn<occupation all>='Percent of column total'
              pctn='Percent of total'),
gender='Gender' all='All Employees'/ rts=50;
format gender gendfmt. occupation occupfmt.;
   title 'Gender Distribution';
   title2 'within Job Classes';
run;
Program Description
Create the JOBCLASS data set. JOBCLASS
contains encoded information about the gender and job class of employees
at a fictitious company.
data jobclass;
   input Gender Occupation @@;
   datalines;
1 1  1 1  1 1  1 1  1 1  1 1  1 1
1 2  1 2  1 2  1 2  1 2  1 2  1 2
1 3  1 3  1 3  1 3  1 3  1 3  1 3
1 1  1 1  1 1  1 2  1 2  1 2  1 2
1 2  1 2  1 3  1 3  1 4  1 4  1 4
1 4  1 4  1 4  1 1  1 1  1 1  1 1
1 1  1 2  1 2  1 2  1 2  1 2  1 2
1 2  1 3  1 3  1 3  1 3  1 4  1 4
1 4  1 4  1 4  1 1  1 3  2 1  2 1
2 1  2 1  2 1  2 1  2 1  2 2  2 2
2 2  2 2  2 2  2 3  2 3  2 3  2 4
2 4  2 4  2 4  2 4  2 4  2 1  2 3
2 3  2 3  2 3  2 3  2 4  2 4  2 4
2 4  2 4  2 1  2 1  2 1  2 1  2 1
2 2  2 2  2 2  2 2  2 2  2 2  2 2
2 3  2 3  2 4  2 4  2 4  2 1  2 1
2 1  2 1  2 1  2 2  2 2  2 2  2 3
2 3  2 3  2 3  2 4
;
Create the GENDFMT. and OCCUPFMT. formats.PROC FORMAT creates formats for the variables Gender
and Occupation.
proc format;
   value gendfmt 1='Female'
                 2='Male'
             other='*** Data Entry Error ***';
   value occupfmt 1='Technical'
                  2='Manager/Supervisor'
                  3='Clerical'
                  4='Administrative'
              other='*** Data Entry Error ***';
run;
Create the report and specify the table options.The FORMAT= option specifies the 8.2 format as the
default format for the value in each table cell.
Specify subgroups for the analysis.The CLASS statement identifies Gender and Occupation
as class variables.
    table (occupation='Job Class' all='All Jobs')
              *(n='Number of employees'*f=9.
              pctn<gender all>='Percent of row total'
              pctn<occupation all>='Percent of column total'
              pctn='Percent of total'),
Define the table columns and specify the amount of space
for row headings.The column dimension
creates a column for each formatted value of Gender and for all employees.
Text in quotation marks supplies the heading for the corresponding
column. The RTS= option provides 50 characters per line for row headings.
Details
Overview
The part of the TABLE
statement that defines the rows of the table uses the PCTN statistic
to calculate three different percentages.
In all calculations
of PCTN, the numerator is N, the frequency count for one cell of the
table. The denominator for each occurrence of PCTN is determined by
the denominator definition. The denominator definition appears in
angle brackets after the keyword PCTN. It is a list of one or more
expressions. The list tells PROC TABULATE which frequency counts to
sum for the denominator.
Analyzing the Structure of the Table
Taking a close look
at the structure of the table helps you understand how PROC TABULATE
uses the denominator definitions. The following simplified version
of the TABLE statement clarifies the basic structure of the table:
The table is a concatenation
of four subtables. In this report, each subtable is a crossing of
one class variable in the row dimension and one class variable in
the column dimension. Each crossing establishes one or more categories.
A category is a combination of unique values of class variables, such
as
female, technical or all,
clerical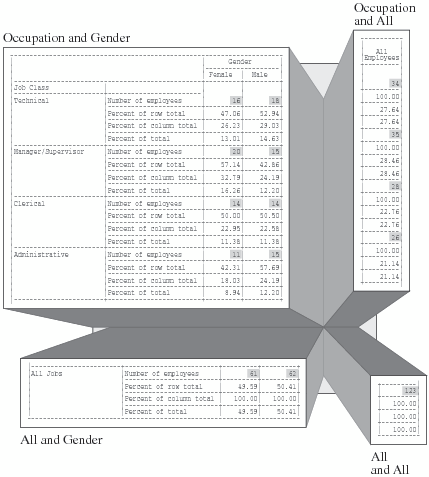
Interpreting Denominator Definitions
The following fragment
of the TABLE statement defines the denominator definitions for this
report. The PCTN keyword and the denominator definitions are highlighted.
Row Percentages
PROC TABULATE looks
at the first element in the denominator definition, Gender, and asks
whether Gender contributes to the subtable. Because Gender does contribute
to the subtable, PROC TABULATE uses it as the denominator definition.
This denominator definition tells PROC TABULATE to sum the frequency
counts for all occurrences of Gender within the same value of Occupation.
For example, the denominator
for the category
female, technical is the
sum of all frequency counts for all categories in this subtable for
which the value of Occupation is technical.
There are two such categories: female, technical and male,
technical. The corresponding frequency counts are 16
and 18. Therefore, the denominator for this category is 16+18, or
34.
PROC TABULATE looks
at the first element in the denominator definition, Gender, and asks
whether Gender contributes to the subtable. Because Gender does contribute
to the subtable, PROC TABULATE uses it as the denominator definition.
This denominator definition tells PROC TABULATE to sum the frequency
counts for all occurrences of Gender in the subtable.
For example, the denominator
for the category
all, female is the sum of
the frequency counts for all, female and all,
male. The corresponding frequency counts are 61 and 62.
Therefore, the denominator for cells in this subtable is 61+62, or
123.
PROC TABULATE looks
at the first element in the denominator definition, Gender, and asks
whether Gender contributes to the subtable. Because Gender does not
contribute to the subtable, PROC TABULATE looks at the next element
in the denominator definition, which is All. The variable All does
contribute to this subtable, so PROC TABULATE uses it as the denominator
definition. All is a reserved class variable with only one category.
Therefore, this denominator definition tells PROC TABULATE to use
the frequency count of All as the denominator.
For example, the denominator
for the category
clerical, all is the frequency
count for that category, 28.
Note: In these table cells, because
the numerator and the denominator are the same, the row percentages
in this subtable are all 100.
PROC TABULATE looks
at the first element in the denominator definition, Gender, and asks
whether Gender contributes to the subtable. Because Gender does not
contribute to the subtable, PROC TABULATE looks at the next element
in the denominator definition, which is All. The variable All does
contribute to this subtable, so PROC TABULATE uses it as the denominator
definition. All is a reserved class variable with only one category.
Therefore, this denominator definition tells PROC TABULATE to use
the frequency count of All as the denominator.
Column Percentages
PROC TABULATE looks
at the first element in the denominator definition, Occupation, and
asks whether Occupation contributes to the subtable. Because Occupation
does contribute to the subtable, PROC TABULATE uses it as the denominator
definition. This denominator definition tells PROC TABULATE to sum
the frequency counts for all occurrences of Occupation within the
same value of Gender.
For example, the denominator
for the category
manager/supervisor, male is
the sum of all frequency counts for all categories in this subtable
for which the value of Gender is male. There
are four such categories: technical, male; manager/supervisor,
male; clerical, male; and administrative,
male. The corresponding frequency counts are 18, 15,
14, and 15. Therefore, the denominator for this category is 18+15+14+15,
or 62.
PROC TABULATE looks
at the first element in the denominator definition, Occupation, and
asks whether Occupation contributes to the subtable. Because Occupation
does not contribute to the subtable, PROC TABULATE looks at the next
element in the denominator definition, which is All. Because the variable
All does contribute to this subtable, PROC TABULATE uses it as the
denominator definition. All is a reserved class variable with only
one category. Therefore, this denominator definition tells PROC TABULATE
to use the frequency count for All as the denominator.
For example, the denominator
for the category
all, female is the frequency
count for that category, 61.
Note: In these table cells, because
the numerator and denominator are the same, the column percentages
in this subtable are all 100.
PROC TABULATE looks
at the first element in the denominator definition, Occupation, and
asks whether Occupation contributes to the subtable. Because Occupation
does contribute to the subtable, PROC TABULATE uses it as the denominator
definition. This denominator definition tells PROC TABULATE to sum
the frequency counts for all occurrences of Occupation in the subtable.
For example, the denominator
for the category
technical, all is the sum
of the frequency counts for technical, all; manager/supervisor,
all; clerical, all; and administrative,
all. The corresponding frequency counts are 34, 35, 28,
and 26. Therefore, the denominator for this category is 34+35+28+26,
or 123.
PROC TABULATE looks
at the first element in the denominator definition, Occupation, and
asks whether Occupation contributes to the subtable. Because Occupation
does not contribute to the subtable, PROC TABULATE looks at the next
element in the denominator definition, which is All. Because the variable
All does contribute to this subtable, PROC TABULATE uses it as the
denominator definition. All is a reserved class variable with only
one category. Therefore, this denominator definition tells PROC TABULATE
to use the frequency count of All as the denominator.