TABULATE Procedure
- Syntax

- Overview
- Concepts
- Using
- Results
- Examples Creating a Basic Two-Dimensional TableSpecifying Class Variable Combinations to Appear in a TableUsing Preloaded Formats with Class VariablesUsing Multilabel FormatsCustomizing Row and Column HeadingsSummarizing Information with the Universal Class Variable ALLEliminating Row HeadingsIndenting Row Headings and Eliminating Horizontal SeparatorsCreating Multipage TablesReporting on Multiple-Response Survey DataReporting on Multiple-Choice Survey DataCalculating Various Percentage StatisticsUsing Denominator Definitions to Display Basic Frequency Counts and PercentagesSpecifying Style Elements for ODS OutputStyle PrecedenceNOCELLMERGE Option
- References
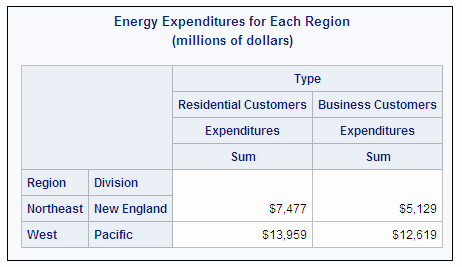
Example 2: Specifying Class Variable Combinations to Appear in a Table
| Features: |
|
| Data set: | ENERGY |
Details
This example does the
following:
-
uses the EXCLUSIVE option to restrict the output to only the combinations specified in the CLASSDATA= data set. Without the EXCLUSIVE option, the output would be the same as in Creating a Basic Two-Dimensional Table.
Program
data classes;
   input region division type;
   datalines;
1 1 1
1 1 2
4 4 1
4 4 2
;
proc tabulate data=energy format=dollar12.
              classdata=classes exclusive;
class region division type;
var expenditures;
   table region*division,
          type*expenditures
/ rts=25;
format region regfmt. division divfmt. type usetype.;
   title 'Energy Expenditures for Each Region';
   title2 '(millions of dollars)';
run;
Program Description
Create the CLASSES data set.CLASSES
contains the combinations of class variable values that PROC TABULATE
uses to create the table.
Specify the table options.CLASSDATA=
and EXCLUSIVE restrict the class level combinations to those that
are specified in the CLASSES data set.
Specify subgroups for the analysis.The CLASS statement separates the analysis by values
of Region, Division, and Type.
Specify the analysis variable.The
VAR statement specifies that PROC TABULATE calculate statistics on
the Expenditures variable.
Define the table rows and columns.The TABLE statement creates a row for each formatted
value of Region. Nested within each row are rows for each formatted
value of Division. The TABLE statement also creates a column for each
formatted value of Type. Each cell that is created by these rows and
columns contains the sum of the analysis variable Expenditures for
all observations that contribute to that cell.