SGPANEL Procedure
- Syntax
 Procedure SyntaxPROC SGPANEL StatementPANELBY StatementBAND StatementBUBBLE StatementDENSITY StatementDOT StatementHBAR StatementHBARPARM StatementHBOX StatementHIGHLOW StatementHISTOGRAM StatementHLINE StatementKEYLEGEND StatementLINEPARM StatementLOESS StatementNEEDLE StatementPBSPLINE StatementREFLINE StatementREG StatementSCATTER StatementSERIES StatementSTEP StatementVBAR StatementVBARPARM StatementVBOX StatementVECTOR StatementVLINE StatementCOLAXIS StatementROWAXIS Statement
 - Overview
- Concepts
- Examples
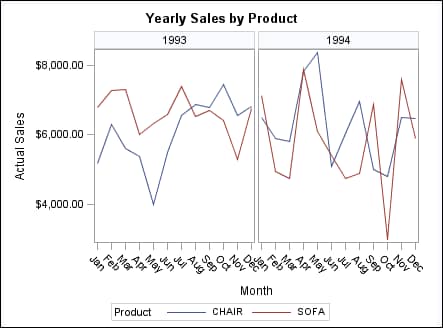
Example 4: Creating a Panel of Line Charts
| Features: |
VLINE statement |
| Sample library member: | SGPNLIN |
Program
proc sgpanel data=sashelp.prdsale;
  where product in ("CHAIR" "SOFA");
  title "Yearly Sales by Product";
panelby year / spacing=5 novarname;
  vline month / response=actual group=product;
run;
title;
Program Description
proc sgpanel data=sashelp.prdsale;
  where product in ("CHAIR" "SOFA");
  title "Yearly Sales by Product";
Specify the classification variable for the panel. The SPACING= option specifies the number of pixels
between the panels in the plot. The NOVARNAME option specifies that
the classification variable name is not shown in the headings for
each cell.