SGPANEL Procedure
- Syntax
 Procedure SyntaxPROC SGPANEL StatementPANELBY StatementBAND StatementBUBBLE StatementDENSITY StatementDOT StatementHBAR StatementHBARPARM StatementHBOX StatementHIGHLOW StatementHISTOGRAM StatementHLINE StatementKEYLEGEND StatementLINEPARM StatementLOESS StatementNEEDLE StatementPBSPLINE StatementREFLINE StatementREG StatementSCATTER StatementSERIES StatementSTEP StatementVBAR StatementVBARPARM StatementVBOX StatementVECTOR StatementVLINE StatementCOLAXIS StatementROWAXIS Statement
 - Overview
- Concepts
- Examples
Concepts: SGPANEL Procedure
Panel Creation
The
SGPANEL procedure has a required PANELBY statement that is used to
define the classifier variables for the panel. This statement must
be specified before any plot, axis, or legend statement or else an
error occurs. You can use options in the PANELBY statement to control
the attributes of the panel. For example, you can use the COLUMNS=
option to specify the number of columns in the panel.
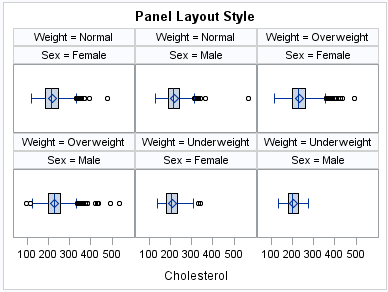
SGPANEL can use four different layouts, which are specified
by the LAYOUT= option in the PANELBY statement. The layout determines
how your classifier variables are used to create the panel, and also
affects the number of classifier variables that you can specify.
The
default layout is PANEL. With this layout, you can specify any number
of classifier variables. The graph cells in the panel are arranged
automatically, and the classifier values are displayed above each
graph cell in the panel. When you specify multiple classifier variables,
the order of the classifier variables determines how the graph cells
are sorted.
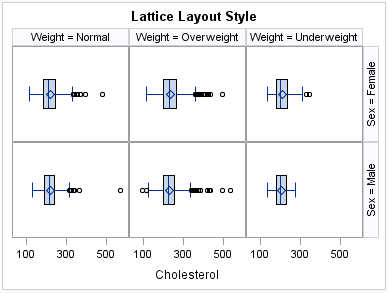
Another
layout is called LATTICE. This layout requires exactly two classifier
variables. The values of the first variable are assigned as columns,
and the values of the second variable are assigned as rows. The classifier
values are displayed above the columns and to the right side of the
rows.
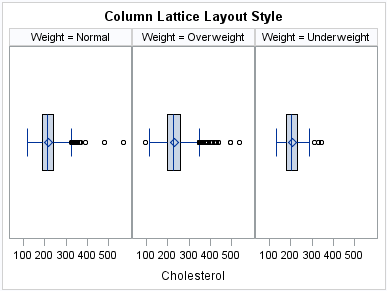
Two additional layouts
are available, which are called COLUMNLATTICE and ROWLATTICE. These
layouts require exactly one classifier variable. The values of the
classifier variable are assigned as cells in a single row or column.
If you have a large
number of classifier variables, then the best method for creating
a panel is to choose one or two classifiers for the PANELBY statement.
Then specify the remaining variables in a BY statement. This method
maximizes the space for the plots and generates results that are easier
to interpret.
Plot Type Compatibility
Each graph cell in your
panel contains one or more plots, and there are four basic types of
plots that you can create with the SGPANEL procedure.
Not all of the plot
types can be used together in the same PROC SGPANEL step. The following
table shows which of the plot types can be used together:
Plot Type Compatibility
Note: Box plots cannot be combined
with any other plot types. Box plots can be overlaid with other box
plots. However, overlaid box plots must have the same category variables.
If you submit a PROC
SGPANEL step that combines two incompatible plot statements, then
an error appears in the log.
The SGPANEL procedure
draws the plots in your graph in the same order that you specify the
plot statements. Because of this, it is important to consider the
order of your plot statements so that your plots do not obscure one
another. For example, if you specify a BAND statement after a SCATTER
statement, then the band plot might obscure the markers in your scatter
plot. You can also avoid obscuring your data by using the TRANSPARENCY=
option to make your plots partially transparent.
Plot Axes
The SGPANEL
procedure contains two statements that enable you to change the type
and appearance for the axes of the graph cells in your panel: COLAXIS
and ROWAXIS.
By default, the type
of each axis is determined by the types of plots that use the axis
and the data that is applied to the axis.
The axis contains independent
data values rather than a range of numeric values. Each distinct value
is represented by a tick mark. Discrete is the default axis type for
character data.
The axis contains a
linear range of numeric values. Linear is the default axis type for
numeric data.
Panel Legends
The SGPANEL procedure creates a legend
automatically based on the plot statements and options that you specify.
The automatic legend functionality determines which information is
likely to be useful in the legend. You can override this behavior
by defining your own legend with the KEYLEGEND statement or by specifying
the NOAUTOLEGEND option in the PROC SGPANEL statement.
You can specify the
labels that represent your plots in the legend by using the LEGENDLABEL=
option in the corresponding plot statements.
You can create customized
legends by using one or more KEYLEGEND statements. You can specify
which plot statements are assigned to the legend, and use options
to control the title, location, and border of the legend. For more
information, see KEYLEGEND Statement.
Automatic Differentiation of Visual Attributes
Depending
on the plots and options that you specify, the SGPANEL procedure can
automatically assign different style attributes to the plots in your
graph. For example, if you specify two series plots, then each series
plot automatically uses a different line pattern and line color by
default. If different attributes are not assigned by default, you
can force the procedure to assign different style attributes by using
the CYCLEATTRS option in the PROC SGPANEL statement. You can also
disable automatic attribute differentiation by using the NOCYCLEATTRS
option in the PROC SGPANEL statement.