Example Program and Statement Details
Example Graph
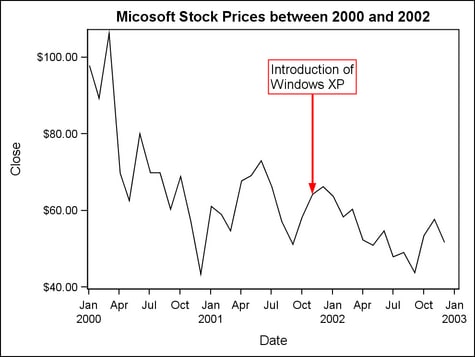
The following graph
was generated by the Example Program. The example
shows a common application of a DRAWARROW and DRAWTEXT statements
to identify a specific part of the graph and add explanatory text.
Example Program
proc template;
  define statgraph arrow;
    begingraph;
      entrytitle "Micosoft Stock Prices between 2000 and 2002";
      layout overlay;
        seriesplot x=date y=close;
        drawarrow x1="01NOV2001"d  y1=75 x2="01NOV2001"d y2=64.21 /
           x1space=datavalue y1space=wallpercent
           x2space=datavalue y2space=datavalue
           arrowheadshape=filled lineattrs=(color=red) ;
        drawtext "Introduction of Windows XP" / width=25 anchor=bottom
           border=true borderattrs=(color=red)
           x="01NOV2001"d y=75 xspace=datavalue yspace=wallpercent;
      endlayout;
    endgraph;
  end;

proc sgrender data=sashelp.stocks template=arrow;
  where stock="Microsoft" and Year(date) between 2000 and 2002;
run;
Statement Summary
A DRAWARROW statement
draws a line (arrow shaft) from a specified starting point (X1,Y1)
to a specified ending point (X2,Y2). It also displays an arrowhead
at either or both ends of the line. DRAWARROW is similar to a DRAWLINE
statement, using many of the same options, but it has additional options
for controlling the arrowhead(s).
For general
information about the types of elements that can be drawn with the
draw statements, the drawing space and drawing units that they use,
and how the drawn elements are anchored, see Key Concepts for Using Draw Statements. For detailed usage information, consult the SAS Graph Template Language: User's Guide.
Options
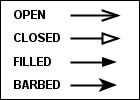
specifies the direction
of the arrowhead(s) at the end(s) of the arrow shaft.
| OUT | specifies a single arrowhead drawn at (X2,Y2) and pointing away from (X1,Y1) |
| IN | specifies a single arrowhead drawn at (X1,Y1) and pointing away from (X2,Y2) |
| BOTH | specifies two arrowheads, one at the IN position and one at the OUT position |
specifies an amount
to offset the arrow from discrete X values, or discrete Y values,
or both.
DRAWSPACE= GRAPHPERCENT | GRAPHPIXEL | LAYOUTPERCENT | LAYOUTPIXEL
| WALLPERCENT | WALLPIXEL | DATAPERCENT | DATAPIXEL | DATAVALUE
specifies a default
drawing space and drawing units for this DRAWARROW statement.
Interaction: This
statement and all of the draw statements inherit the global DRAWPSACE=
setting from the DRAWSPACE= option in the BEGINGRAPH statement. Setting
this option changes the setting for only this DRAWARROW statement.
specifies whether the
arrow appears on top of (FRONT) or behind (BACK) the graph.
Interaction: If
this option is set to BACK, the arrow is drawn behind background areas,
such as a layout or legend background.For elements that are obstructed because they are in the
back layer, you can suppress the display of filled areas in the graph.
Or, you can use transparency to manage the element visibility. For
more information, see About Drawing Layers.
specifies the appearance
of the arrow shaft and arrowhead(s). See General Syntax for Attribute Options for the syntax
on using a style-element and Line Options for available line-options.
X1SPACE= GRAPHPERCENT | GRAPHPIXEL | LAYOUTPERCENT | LAYOUTPIXEL
| WALLPERCENT | WALLPIXEL | DATAPERCENT | DATAPIXEL | DATAVALUE
specifies the drawing
space and drawing units for interpreting the X1 value.
X2SPACE= GRAPHPERCENT | GRAPHPIXEL | LAYOUTPERCENT | LAYOUTPIXEL
| WALLPERCENT | WALLPIXEL | DATAPERCENT | DATAPIXEL | DATAVALUE
specifies the drawing
space and drawing units for interpreting the X2 value
Y1SPACE= GRAPHPERCENT | GRAPHPIXEL | LAYOUTPERCENT | LAYOUTPIXEL
| WALLPERCENT | WALLPIXEL | DATAPERCENT | DATAPIXEL | DATAVALUE
specifies the drawing
space and drawing units for interpreting the Y1 value.