Example Program and Statement Details
Example Graph
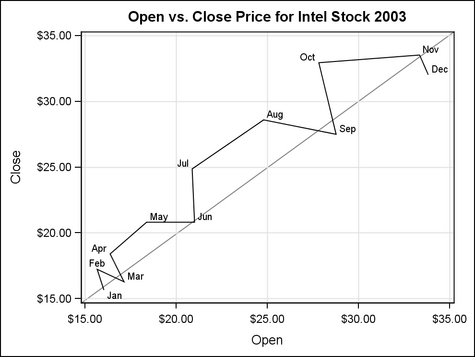
The following graph
was generated by the Example Program. The example
shows how to draw a diagonal reference line. One endpoint is point
0,0 and the other is point 100,100. Both points are specified in the
WALL area with PERCENT units, making it easy to position the line
without regard to the axis data ranges or the axis offsets. To draw
the line behind the series line and grid lines, you can set LAYER=BACK and use the parent layout statement to
turn off the display of the wall.
Example Program
proc template;
  define statgraph diagonal;
    begingraph;
      entrytitle "Open vs. Close Price for Intel Stock 2003";
      layout overlay / walldisplay=(outline)
          xaxisopts=(griddisplay=on
          yaxisopts=(griddisplay=on);
        seriesplot x=open y=close / datalabel=date;
        drawline x1=0 y1=0 x2=100 y2=100 /
          x1space=wallpercent y1space=wallpercent
          x2space=wallpercent y2space=wallpercent
          lineattrs=GraphReference layer=back ;
      endlayout;
    endgraph;
  end;

proc sgrender data=sashelp.stocks template=diagonal;
  where stock="Intel" and year(date)=2003;
  format date monname3.;
run;
Statement Summary
A DRAWLINE statement
draws a line from a starting point that is specified with the X1 and
Y1 arguments, to an ending point that is specified with the X2 and
Y2 arguments. DRAWLINE is similar to a DRAWARROW statement, using
many of the same options, but without the options for controlling
the arrowhead(s).
For general
information about the types of elements that can be drawn with the
draw statements, the drawing space and drawing units that they use,
and how the drawn elements are anchored, see Key Concepts for Using Draw Statements. For detailed usage information, consult the SAS Graph Template Language: User's Guide.
Options
specifies an amount
to offset the line from discrete X values, or discrete Y values, or
both.
DRAWSPACE= GRAPHPERCENT | GRAPHPIXEL | LAYOUTPERCENT | LAYOUTPIXEL
| WALLPERCENT | WALLPIXEL | DATAPERCENT | DATAPIXEL | DATAVALUE
specifies a default
drawing space and drawing units for this DRAWLINE statement.
Interaction: This statement and all of the draw statements inherit the global
DRAWPSACE= setting from the DRAWSPACE= option in the BEGINGRAPH statement.
Setting this option changes the setting for only this DRAWLINE statement.
specifies whether the
line appears on top of (FRONT) or behind (BACK) the graph.
Interaction: If this option is set to BACK, the line is drawn behind background
areas, such as a layout or legend background.For elements that are obstructed because they are in the
back layer, you can suppress the display of filled areas in the graph.
Or, you can use transparency to manage the element visibility. For
more information, see About Drawing Layers.
specifies the appearance
of the line. See General Syntax for Attribute Options for the syntax
on using a style-element and Line Options for available line-options.
X1SPACE= GRAPHPERCENT | GRAPHPIXEL | LAYOUTPERCENT | LAYOUTPIXEL
| WALLPERCENT | WALLPIXEL | DATAPERCENT | DATAPIXEL | DATAVALUE
specifies the drawing
space and drawing units for interpreting the X1 value.
X2SPACE= GRAPHPERCENT | GRAPHPIXEL | LAYOUTPERCENT | LAYOUTPIXEL
| WALLPERCENT | WALLPIXEL | DATAPERCENT | DATAPIXEL | DATAVALUE
specifies the drawing
space and drawing units for interpreting the X2 value
Y1SPACE= GRAPHPERCENT | GRAPHPIXEL | LAYOUTPERCENT | LAYOUTPIXEL
| WALLPERCENT | WALLPIXEL | DATAPERCENT | DATAPIXEL | DATAVALUE
specifies the drawing
space and drawing units for interpreting the Y1 value.