About Drawing Layers
A draw statement can
draw its element in either of two “layers” in the graph:
the front layer or the back layer. By default, the statement draws
in the front layer, which places the element in front of all other
graphics elements, including data points, data labels, axis labels,
and so on. In some cases, this might cause the drawn element to block
the view of other graphics elements in the graph.
To prevent a drawn element
for blocking the view of other graphics elements in the graph, you
can use the draw statement’s TRANSPARENCY= option to add transparency
to the drawn element. With an appropriate transparency setting, you
should be able to see any graphics elements that are behind the drawn
element.
Alternatively, you can
use the draw statement’s LAYER= option to draw the element
in the back layer, which places the drawn element behind all other
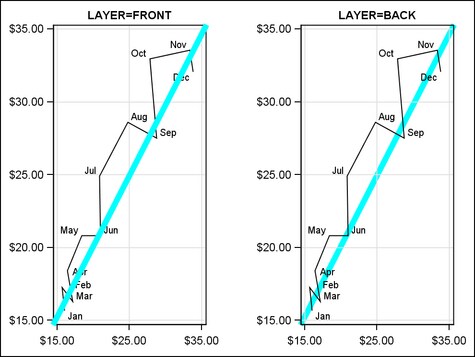
graphics elements in the graph. For example, the following figure
shows two different versions of a graph that uses DRAWLINE to draw
a diagonal line across the axis area. The version to the left draws
the line in the front layer, which causes the line to cover some of
the data labels in the graph and portions of the series line. The
version to the right uses LAYER=BACK to draw the line in the back
layer. This prevents the line from covering the data labels and the
portions of the series line.
The following code fragment
shows the code that positions the line in the back layer:
layout overlay / walldisplay=(outline)
    xaxisopts=(griddisplay=on display=(line ticks tickvalues))
    yaxisopts=(griddisplay=on display=(line ticks tickvalues));
  seriesplot x=open y=close / datalabel=date;
  drawline x1=0 y1=0 x2=100 y2=100 /
    x1space=wallpercent y1space=wallpercent
    x2space=wallpercent y2space=wallpercent
    lineattrs=(color=cyan thickness=6) layer=back ;
endlayout;
The Back Layer
is Behind the Background. Although drawing elements in
the back layer prevents them from obstructing other data elements
in the graph, it is not always the right solution to the problem.
If a draw statement
uses LAYER=BACK, it draws the element behind all other graphics elements,
such as the layout background or a discrete legend’s background.
To ensure that the element is visible in the graph, you might have
to do one or more of the following:
-
In overlay-type layouts or in a SCATTERPLOTMATRIX, you can use the parent layout’s WALLDISPLAY= option to turn off the display of the plot wall. In the example code just shown, WALLDISPLAY=(OUTLINE) displays an outline around the graph wall but does not display the wall fill. Suppressing the fill ensures that the drawn line is visible behind the plot wall.
-
If a layout container uses OPAQUE=TRUE so that it can set visual attributes for the background, the opaque background covers and therefore hides any drawn element that is behind the background. When assigning visual attributes to a graph background, therefore, it might be better to use TRANSPARENCY= rather than LAYER= to prevent drawn elements from covering other graphics elements in the graph.