GAREABAR Procedure

Example 3: Generating an Area Bar Chart with Subgroups
| Features: |
|
| Sample library member: | GABSUBGR |
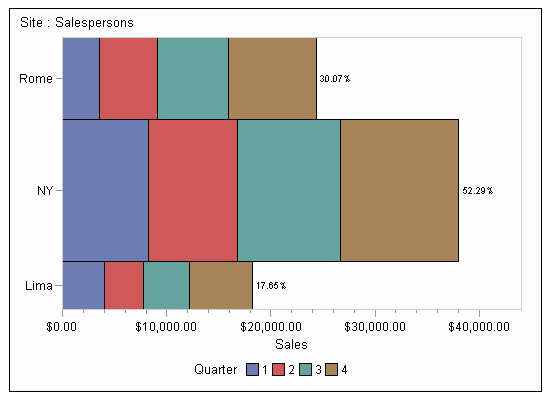
This example uses the
SUBGROUP= option to display the same statistics as displayed by Examples
1 and 2. Similar to Example 1, this example shows the total sales
for each of the three geographic sites. The relative thickness of
each bar represents the number of salespersons at each site.
The addition of subgroups
to this chart shows the relative percentage of sales for each quarter.
This chart demonstrates that all of the sites had most of their sales
posted in the fourth quarter.
Program
goptions reset=all dev=activex;
data totals;
 input Site $ Quarter Sales Salespersons;
format Sales dollar12.2;
datalines;
Lima 1 4043.97  4
NY    1 8225.26 12
Rome  1 3543.97  6
Lima  2 3723.44  5
NY     2 8595.07 18
Rome  2 5558.29 10
Lima  3 4437.96  8
NY      3 9847.91 24
Rome  3 6789.85 14
Lima  4 6065.57 10
NY     4 11388.51 26
Rome 4  8509.08 16
;
proc gareabar data=totals;
   hbar site*salespersons /
      sumvar=sales
      subgroup=quarter
      wstat=PCT;
run;
quit;
Program Description
data totals;
 input Site $ Quarter Sales Salespersons;
format Sales dollar12.2;
datalines;
Lima 1 4043.97  4
NY    1 8225.26 12
Rome  1 3543.97  6
Lima  2 3723.44  5
NY     2 8595.07 18
Rome  2 5558.29 10
Lima  3 4437.96  8
NY      3 9847.91 24
Rome  3 6789.85 14
Lima  4 6065.57 10
NY     4 11388.51 26
Rome 4  8509.08 16
;
Run PROC GAREABAR with an HBAR statement. The HBAR statement creates a horizontal bar for
each value of SITE. The SALESPERSONS variable sets the width of each
bar. The SUMVAR=SALES option sets the length of each bar. The WSTAT=PERCENT
option displays the width statistic as a percentage, which enables
you to compare the distribution of salespersons for each quarter.
The SUBGROUP=QUARTER option and the RSTAT=SUM option are reflected
in the statistics that are displayed as absolute numbers along the
horizontal bar.