GAREABAR Procedure

Example 2: Generating an Area Bar Chart with a Numeric Chart Variable
| Features: |
|
| Sample library member: | GABNUMVR |
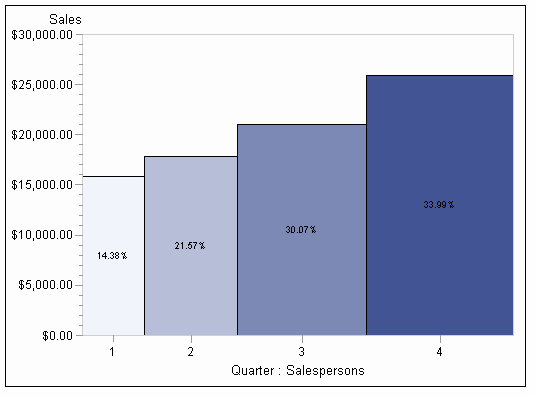
This chart displays
a numeric chart variable, QUARTER, representing the four quarters
of an unspecified year. The GAREABAR procedure treats all values of
a numeric chart variables as discrete, unless the CONTINUOUS option
is used. GAREABAR does not calculate midpoints.
The total sales for
each quarter of the year are represented by the height of each bar
along the vertical axis. The width of each bar along the horizontal
axis indicates the percentage of salespersons during each quarter.
The chart shows the correlation between the number of salespersons,
and the total sales.
Program
goptions reset=all dev=activex;
data totals;
 input Site $ Quarter Sales Salespersons;
format Sales dollar12.2;
datalines;
Lima  1 4043.97    4
NY     1  8225.26   12
Rome  1 3543.97    6
Lima  2  3723.44    5
NY      2  8595.07   18
Rome  2 5558.29   10
Lima  3 4437.96    8
NY     3  9847.91   24
Rome  3 6789.85   14
Lima  4  6065.57   10
NY     4  11388.51  26
Rome  4  8509.08   16
;
proc gareabar data=totals;
   vbar quarter*salespersons/
      sumvar=sales
      wstat=pct;
run;
quit;
Program Description
data totals;
 input Site $ Quarter Sales Salespersons;
format Sales dollar12.2;
datalines;
Lima  1 4043.97    4
NY     1  8225.26   12
Rome  1 3543.97    6
Lima  2  3723.44    5
NY      2  8595.07   18
Rome  2 5558.29   10
Lima  3 4437.96    8
NY     3  9847.91   24
Rome  3 6789.85   14
Lima  4  6065.57   10
NY     4  11388.51  26
Rome  4  8509.08   16
;
Run PROC GAREABAR with VBAR statement. The VBAR statement creates a vertical bar for each
value of QUARTER. The SALESPERSONS variable sets the width of the
bars. The SUMVAR=SALES option controls the height of each of the bars.
The WSTAT=PCT option displays the width statistic as a percentage
(the number of salespersons as a percentage of the whole).