GAREABAR Procedure

Example 4: Area Bar Chart with Subgroups; Using the RSTAT= option and the WSTAT= option to Calculate Statistics as Percentages
| Features: |
|
| Sample library member: | GABWSTAT |
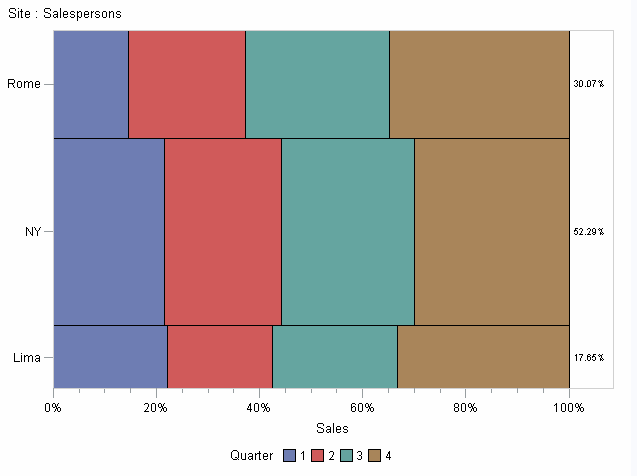
This example uses the
RSTAT= option and the WSTAT= option to calculate percentages for the
length variable (sumvar) and the width variable (chart variable).
The SUBGROUP= option subgroups each bar by quarter.
When the SUBGROUP= option
is specified, you can use the RSTAT= option to specify whether the
SUMVAR= option variable is to be calculated as a percentage or as
a sum.
Program
goptions reset=all dev=activex;
data totals;
input Site $ Quarter Sales Salespersons;
format Sales dollar12.2;
datalines;
Lima    1   4043.97    4
NY       1   8225.26   12
Rome   1   3543.97    6
Lima    2   3723.44    5
NY     2    8595.07   18
Rome  2   5558.29   10
Lima    3   4437.96    8
NY       3   9847.91   24
Rome   3   6789.85   14
Lima    4   6065.57   10
NY       4 11388.51   26
Rome   4   8509.08   16
;
proc gareabar data=totals;
   hbar site*salespersons /
      sumvar=sales
      subgroup=quarter
      rstat=PCT
      wstat=PCT;
run;
quit;
Program Description
data totals;
input Site $ Quarter Sales Salespersons;
format Sales dollar12.2;
datalines;
Lima    1   4043.97    4
NY       1   8225.26   12
Rome   1   3543.97    6
Lima    2   3723.44    5
NY     2    8595.07   18
Rome  2   5558.29   10
Lima    3   4437.96    8
NY       3   9847.91   24
Rome   3   6789.85   14
Lima    4   6065.57   10
NY       4 11388.51   26
Rome   4   8509.08   16
;
Run PROC GAREABAR with an HBAR statement. The HBAR statement creates a horizontal bar for
each value of SITE. The SALESPERSONS variable sets the width of each
bar. The SUMVAR=SALES option sets the length of each bar. The WSTAT=PERCENT
option displays the width statistic as a percentage. (The percentage
of salespersons is shown by the relative thickness of each bar along
the vertical axis.) The SUBGROUP=QUARTER option and the RSTAT=PCT
option, request that the sales for each quarter are displayed as a
percentage on the horizontal axis.