GANNO Procedure

Example 1: Scaling Data-Dependent Output
| Features: |
PROC GANNO statement options ANNOTATE= and DATASYS |
| Sample library member: | GANSCALE |
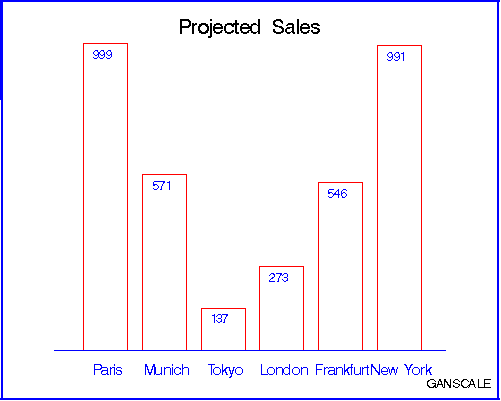
This example uses an Annotate data
set to scale data-dependent output with the DATASYS option and create
a vertical bar chart of sales for each of six sites. The values that
determine the height of each bar range from 137 to 999. The range
of values is so large that the GANNO procedure cannot fit all of the
bars in the output area without scaling the output. This program uses
the DATASYS option to scale the data values so that the bars fit in
the graphics output area.
Program
goptions reset=all border;
data wrldtotl;
   length sitename $ 10;
   input sitename $ 1-10 mean 12-15;
   datalines;
Paris      999
Munich     571
Tokyo      137
London     273
Frankfurt  546
New York   991
;
run;
data wrldanno;
   length function color $ 8 text $ 20;
   retain line 0 xsys ysys "2" hsys "3" x 8;
   set wrldtotl end=end;
   function="move"; x=x+8; y=20; output;
   function="bar"; y=y+(mean); x=x+9;
      style="empty"; color="red"; output;
   function="label"; y=0; x=x-4; size=3.5;
      position="E"; style="swiss";
      color="blue"; text=sitename; output;
   function="move"; y=y+(mean)-3; output;
   function="label"; x=x-1; text=left(put(mean,3.));
      position="5"; style="swiss"; size=3; output;
   if end then do;
      function="move"; x=10; y=20; output;
      function="draw"; x=90; y=20; line=1;
         size=.5; color="blue"; output;
      function="label"; x=50; y=95; text="Projected Sales";
         xsys="3"; ysys="3"; position="5"; style="swissb";
         size=5; color=" "; output;
         x=92; y=5; size=3; style="swiss"; text="GANSCALE"; output;
      function="frame"; color="blue"; when="b";
         style="empty"; output;
   end;
run;
proc ganno annotate=wrldanno
   datasys;
run;
quit;
Program Description
Create the data set WRLDTOTL. WRLDTOTL contains sales data for six sites. SITENAME contains the
names of the sites. MEAN contains the average sales for each site.
data wrldtotl;
   length sitename $ 10;
   input sitename $ 1-10 mean 12-15;
   datalines;
Paris      999
Munich     571
Tokyo      137
London     273
Frankfurt  546
New York   991
;
run;
Create the Annotate data set, WRLDANNO. XSYS and YSYS specify coordinate system 2 (absolute
data values) for X and Y. HSYS specifies coordinate system 3 (percent
of the graphics output area) for SIZE. The SET statement processes
every observation in WRLDTOTL.
data wrldanno;
   length function color $ 8 text $ 20;
   retain line 0 xsys ysys "2" hsys "3" x 8;
   set wrldtotl end=end;
Draw the bars. The MOVE
function defines the lower left corner of the bar. The BAR function
draws the bar. Bar height (Y) is controlled by MEAN.
   function="move"; x=x+8; y=20; output;
   function="bar"; y=y+(mean); x=x+9;
style="empty"; color="red"; output; function="label"; y=0; x=x-4; size=3.5;
position="E"; style="swiss";
color="blue"; text=sitename; output; function="move"; y=y+(mean)-3; output;
function="label"; x=x-1; text=left(put(mean,3.));
position="5"; style="swiss"; size=3; output;After all the observations are processed, add an axis
line, title, footnote, and frame. The
MOVE and DRAW functions draw the axis line. The LABEL function writes
the title and the footnote. The FRAME function draws a border around
the output.
   if end then do;
      function="move"; x=10; y=20; output;
      function="draw"; x=90; y=20; line=1;
         size=.5; color="blue"; output;
      function="label"; x=50; y=95; text="Projected Sales";
         xsys="3"; ysys="3"; position="5"; style="swissb";
         size=5; color=" "; output;
         x=92; y=5; size=3; style="swiss"; text="GANSCALE"; output;
      function="frame"; color="blue"; when="b";
         style="empty"; output;
   end;
run;
Display the annotate graphics. The ANNOTATE= option identifies the data set that contains the graphics
commands. DATASYS tells the procedure to use the maximum and minimum
data values to construct the output environment. In addition, the
values of X and Y are scaled to fit the environment and all of the
bars display on the graph.