GANNO Procedure
Example 2: Storing Annotate Graphics
| Features: |
PROC GANNO statement options DESCRIPTION=, GOUT=, and NAME= |
| Sample library member: | GANSQUAR |
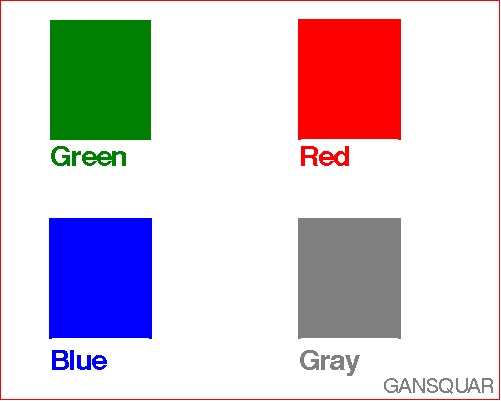
This example
creates an Annotate data set that draws four colored squares, displays
the data set as a single graphics output, and stores the output as
a catalog entry in a permanent catalog. In this example, the NAME=
option specifies a text string that identifies the name that is stored
with the graphics output in the catalog.
Program
goptions reset=all border;
data squares;
   length function style color $ 8 text $ 15;
   xsys="3"; ysys="3";
   color="green";
   function="move"; x=10; y=65; output;
   function="bar";  x=30; y=95; style="solid"; output;
   function="label"; x=10; y=63; position="6";
      style="swissb"; size=2; text="Green"; output;
   color="red";
   function="move"; x=60; y=65; output;
   function="bar";  x=80; y=95; output;
   function="label"; x=60; y=63; position="6";
      style="swissb"; size=2; text="Red"; output;
   color="blue";
   function="move"; x=10; y=15; output;
   function="bar";  x=30; y=45; output;
   function="label"; x=10; y=12; position="6";
      style="swissb"; size=2; text="Blue"; output;
   color="gray";
   function="move"; x=60; y=15; output;
   function="bar";  x=80; y=45; output;
   function="label"; x=60; y=12; position="6";
      style="swissb"; size=2; text="Gray"; output;
   x=88; y=5; position="5"; size=1.5; style="swiss";
      text="GANSQUAR"; output;
   function="frame"; color="red"; when="b";
      style="empty"; output;
run;
proc ganno annotate=squares
   gout=excat
   name="GANSQUAR"
   description="Four squares";
run;
quit;
Program Description
Create the Annotate data set, SQUARES. XSYS and YSYS specify coordinate system 3 (percent
of the graphics output area) for X and Y.
Draw the first square. The
COLOR variable assigns the color for the square. The FUNCTION variable
selects the operation to be performed by the Annotate facility. The
X and Y variables contain coordinate values. The BAR function draws
the square. When the STYLE variable is used with the BAR function,
it selects the fill pattern for the bar.
   color="green";
   function="move"; x=10; y=65; output;
   function="bar";  x=30; y=95; style="solid"; output;
Label the first square. The
LABEL function creates the label. The POSITION value of 6 left-justifies
the text with respect to X and Y. The TEXT variable specifies the
text string to be written.
   color="red";
   function="move"; x=60; y=65; output;
   function="bar";  x=80; y=95; output;
   function="label"; x=60; y=63; position="6";
style="swissb"; size=2; text="Red"; output; color="blue";
function="move"; x=10; y=15; output;
function="bar"; x=30; y=45; output;
function="label"; x=10; y=12; position="6";
style="swissb"; size=2; text="Blue"; output; color="gray";
function="move"; x=60; y=15; output;
function="bar"; x=80; y=45; output;
function="label"; x=60; y=12; position="6";
style="swissb"; size=2; text="Gray"; output;
