GANNO Procedure

Example 3: Using the NAME= Option to Produce Multiple Graphs
| Features: |
PROC GANNO statement option NAME= |
| Sample library member: | GANMULTI |
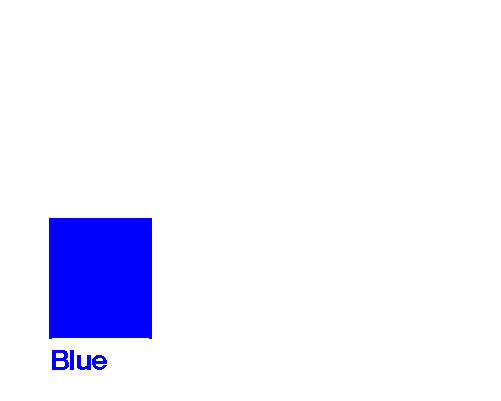
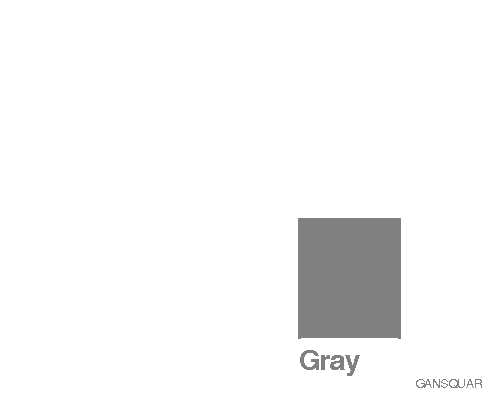
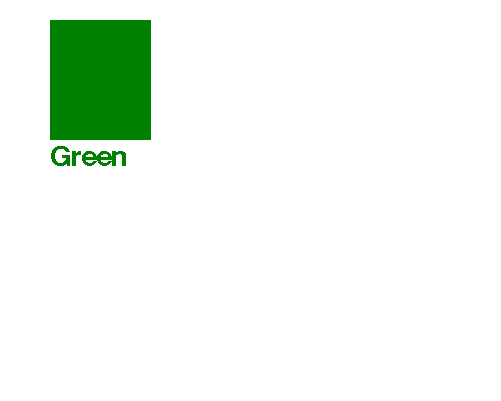
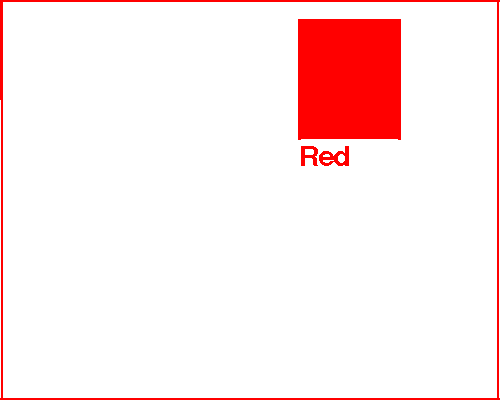
In this example, the
GANNO procedure uses the NAME= option to generate multiple graphs
from one Annotate data set. Since NAME= is assigned the variable COLOR,
the GANNO procedure generates separate graphics output for each value
of the COLOR, as shown in Output for COLOR Value BLUE (WORK.EXCAT.BLUE.GRSEG), Output for COLOR Value GRAY (WORK.EXCAT.GRAY.GRSEG), Output for COLOR Value GREEN (WORK.EXCAT.GREEN.GRSEG) and Output for COLOR Value RED (WORK.EXCAT.RED.GRSEG).
Each output is stored
as a separate entry in the temporary output catalog WORK.EXCAT. The
entries are named according to the values of COLOR:
BLUE,
                     GRAY, GREEN
, and RED. Note that
the output for GRAY includes the footnote
shown in Storing Annotate Graphics. The output for RED shows the
frame that is generated by the Annotate data set. The black borders
in the other outputs are not generated by the code.
Program
goptions reset=all border;
data squares;
   length function style color $ 8 text $ 15;
   xsys="3"; ysys="3";
   color="green";
   function="move"; x=10; y=65; output;
   function="bar";  x=30; y=95; style="solid"; output;
   function="label"; x=10; y=63; position="6";
      style="swissb"; size=2; text="Green"; output;
   color="red";
   function="move"; x=60; y=65; output;
   function="bar";  x=80; y=95; output;
   function="label"; x=60; y=63; position="6";
      style="swissb"; size=2; text="Red"; output;
   color="blue";
   function="move"; x=10; y=15; output;
   function="bar";  x=30; y=45; output;
   function="label"; x=10; y=12; position="6";
      style="swissb"; size=2; text="Blue"; output;
   color="gray";
   function="move"; x=60; y=15; output;
   function="bar";  x=80; y=45; output;
   function="label"; x=60; y=12; position="6";
      style="swissb"; size=2; text="Gray"; output;
   x=88; y=5; position="5"; size=1.5; style="swiss";
      text="GANSQUAR"; output;
   function="frame"; color="red"; when="b";
      style="empty"; output;
run;
proc ganno annotate=squares
           name=color
           gout=excat
           description="Individual squares";
run;
Program Description
Create the Annotate data set, SQUARES. XSYS and YSYS specify coordinate system 3 (percent
of the graphics output area) for X and Y.
Draw the first square. The
COLOR variable assigns the color for the square. The FUNCTION variable
selects the operation to be performed by the Annotate facility. The
X and Y variables contain coordinate values. The BAR function draws
the square. When the STYLE variable is used with the BAR function,
it selects the fill pattern for the bar.
   color="green";
   function="move"; x=10; y=65; output;
   function="bar";  x=30; y=95; style="solid"; output;
Label the first square. The
LABEL function creates the label. The POSITION value of 6 left-justifies
the text with respect to X and Y. The TEXT variable specifies the
text string to be written.
   color="red";
   function="move"; x=60; y=65; output;
   function="bar";  x=80; y=95; output;
   function="label"; x=60; y=63; position="6";
style="swissb"; size=2; text="Red"; output; color="blue";
function="move"; x=10; y=15; output;
function="bar"; x=30; y=45; output;
function="label"; x=10; y=12; position="6";
style="swissb"; size=2; text="Blue"; output; color="gray";
function="move"; x=60; y=15; output;
function="bar"; x=80; y=45; output;
function="label"; x=60; y=12; position="6";
style="swissb"; size=2; text="Gray"; output;