G3D Procedure

Example 4: Generating a Scatter Plot
| Features: |
SCATTER statement
|
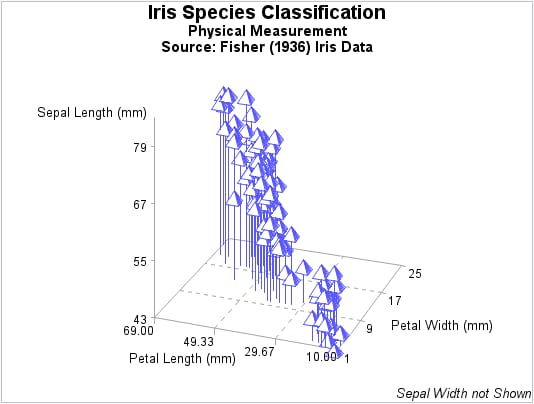
This scatter plot examines
the results of measuring the petal length, petal width, and sepal
length for the flowers of three species of irises. The Scatter statement
in this example relies on the procedure defaults to scale the axes
to include all the data values, label the axes with the variable's
labels, divide the axes into three even intervals, rotate the horizontal
plane 70 degrees around the vertical axis, tilt the plot 70 degrees
toward you, and display the plot with the default ODS style.
Program
goptions reset=all border;
title1 "Iris Species Classification";
title2 "Physical Measurement";
title3 "Source: Fisher (1936) Iris Data";
footnote1 j=r "Sepal Width not Shown";
proc g3d data=sashelp.iris;
  scatter PetalLength*PetalWidth=SepalLength /
     color="light blue"
     size=1.5;

run;
quit;