G3D Procedure

SCATTER Statement
Creates three-dimensional scatter plots using values
of three numeric variables from the input data set.
| Alias: | SCAT |
| Restriction: | The AXIS statement is partially supported by Java and ActiveX devices only. |
| Requirement: | One plot request is required. |
| Global statements: | AXIS, BY, FOOTNOTE, GOPTIONS, NOTE, TITLE |
| Notes: | The procedure can include the FORMAT, LABEL, and WHERE
statements.
The SCATTER statement does not require a full grid of observations to generate a plot. |
Syntax
SCATTER y*x=z </option(s)>;
Summary of Optional Arguments
Appearance options
specifies an annotate data set to annotate plots
that are produced by the SCATTER statement.
specifies a color name or a character variable in
the input data set whose values are color names.
specifies that a plot has no lines that connect
the shapes representing data points to the X-Y plane.
specifies one or more angles at which to rotate
the X-Y plane around the perpendicular Z axis.
specifies a symbol name or a character variable
whose values are symbol names.
specifies either a constant or a numeric variable,
the values of which determine the size of symbol shapes on the scatter
plot.
specifies one or more angles at which to tilt the
graph toward you.
Axes options
specifies a color for axis lines, tick marks, and
horizontal grid lines.
specifies a color for all text on the axes, including
tick mark values and axis labels.
draws reference lines at the major tick marks on
all axes.
specifies that a plot has no axes, including labels,
tick marks, and values.
specifies that a plot has no axes labels or tick
mark values.
assigns an axis definition.
specify the number of major tick marks that are
located on a plot's X axis.
assigns an axis definition.
specify the number of major tick marks that are
located on a plot's Y axis.
assigns an axis definition.
specify the maximum data value that is displayed
on a plot's Z axis.
specifies the minimum value that is displayed on
a plot's Z axis.
specify the number of major tick marks that are
located on a plot's Z axis.
Catalog entry description options
specifies the description of the plot.
specifies the name of the GRSEG catalog entry, and
the name of any graphics output file created.
Optional Arguments
Options in a SCATTER statement affect all graphs that are produced by that statement. You can specify as many options as you want and list them in any order.
- ANNOTATE=annotate-data-set
- specifies an annotate data set to annotate plots that are produced by the SCATTER statement.
- CAXIS=axis-color
- specifies a color for axis lines, tick marks, and
horizontal grid lines. Style reference:Color attribute of the GraphAxisLines elementRestriction:The AXIS statement is partially supported by Java and ActiveX. When the AXIS statement specifies only general axis colors with its COLOR= option, it is overridden by the CAXIS= color option.
- COLOR=“data-point-color” | data-point-color-variable
- specifies a color name or a character variable in
the input data set whose values are color names. These color values
determine the color or colors of the shapes that represent a plot's
data points. Color values must be valid color names for the device
that is used.Using a list of colors in the value of the data-point-color-variable enables you to assign different colors to the shapes to classify data.Style reference:Color attribute of the GraphData1 element
- CTEXT=text-color
- specifies a color for all text on the axes, including
tick mark values and axis labels. The G3D procedure uses
the first color that it finds from the following list: Style reference:Color attribute of the GraphValueText and GraphLabelText elementsNotes:If you use a BY statement in the procedure, the color of the BY variable label is controlled by the CBY= option in the GOPTIONS statement.
For Java and ActiveX only, specific text options specified in the AXIS statement override the CTEXT= option.
- DESCRIPTION=“description”
- specifies the description of the plot. The descriptive text
is displayed as follows:
- NAME=“name”
- specifies the name of the GRSEG catalog entry, and
the name of any graphics output file created. The
name can be up to 256 characters long. If the name duplicates an existing
name,
SAS/GRAPH adds a number, or increments the last number used to create a unique graph name–for example G3D1. If the name specified is exactly eight characters long, the last character of the image output file is replaced with a number–for example, myimages is changed to myimage1.Default:Procedure name
- NOAXIS
- specifies that a plot has no axes, including labels,
tick marks, and values. Use this option if
you want to generate axes with an annotate data set.Alias:NOAXES
- NOLABEL
- specifies that a plot has no axes labels or tick mark values. Use this option if you want to generate axis labels and tick mark values with an annotate data set.
- NONEEDLE
- specifies that a plot has no lines that connect
the shapes representing data points to the X-Y plane. Restriction:The NONEEDLE option has no effect when SHAPE=“PILLAR” or when SHAPE=“PRISM”
- ROTATE=angle-list
- specifies one or more angles at which to rotate
the X-Y plane around the perpendicular Z axis. Specify the value in
degrees. The values specified in the angle-list can be negative or positive. The value can be greater than 360 degrees.
If you specify a sequence of angles, separate graphs are produced
for each angle. The angles that are specified in the ROTATE= option
are paired with any angles that are specified with the TILT= option.
If one option contains fewer values than the other, the last value
in the shorter list is paired with the remaining values in the longer
list. The angle-list list is
in one of the following forms: Default:70 degrees
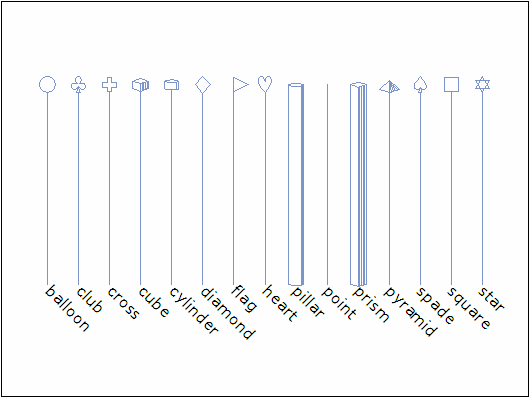
- SHAPE=“symbol-name” | shape-variable
- specifies a symbol name or a character variable
whose values are symbol names. If you specify SHAPE=“symbol-name”, all data points
are drawn in that shape.If you specify SHAPE=shape-variable, the shape of the data point is determined by the value of the shape variable, in the input data set, for that observation. For example, the procedure uses the value of the variable CLASS for a particular observation as the shape for that data point when you specify:
shape=class
Using a list of values in the variable named in SHAPE=shape-variable enables you to assign different shapes to the data points, to categorize your data.Default:PyramidRestriction:These symbols might vary for Java and ActiveX
- SIZE=symbol-size | size-variable
- specifies either a constant or a numeric variable,
the values of which determine the size of symbol shapes on the scatter
plot. If you specify SIZE=symbol-size, all data points are drawn in that
size.If you specify SIZE=size-variable, the size of the data point is determined by the value of the size variable, in the input data set for that observation. For example, when you specify SIZE=CLASS, the procedure uses the value of the variable CLASS, for each observation in the input data set as the size of that data point. If you use a list of sizes as the value of the variable named in SIZE=size-variable, you can assign different sizes to the data points to categorize your data.
- TILT=angle-list
- specifies one or more angles at which to tilt the
graph toward you. The value must be specified
in degrees. The valid values specified in the angle-list are 0 through 90. To generate a sequence of graphs, specify different
angles, and a graph is generated for each angle. The angles that are
specified in the TILT= option are paired with any angles that are
specified with the ROTATE= option. If one option contains fewer values
than the other, the last value in the shorter list is paired with
the remaining values in the longer list. The angle-list is in one of the following forms: Default:70 degrees
- XAXIS= AXIS<1...<99>
- assigns an axis definition. Restriction:Partially supported by Java and ActiveX
- XTICKNUM=number-of-tick-marks
- specify the number of major tick marks that are
located on a plot's X axis. At least two values
are needed to generate the axis.Default:4 (except Java and ActiveX are 5)
- YAXIS= AXIS<1...<99>
- assigns an axis definition. Restriction:Partially supported by Java and ActiveX only
- YTICKNUM=number-of-tick-marks
- specify the number of major tick marks that are
located on a plot's Y axis. At least two values
are needed to generate the axis.Default:4 (except Java and ActiveX are 5)
- ZAXIS= AXIS<1...<99>
- assigns an axis definition. Restriction:Partially supported by Java and ActiveX
- ZMAX=maximum-value
- specify the maximum data value that is displayed
on a plot's Z axis. You can use the ZMAX=
option to extend the Z axis beyond the value range. The value that
is specified by the ZMAX= option must be greater than that specified
by the ZMIN= option. If you specify the ZMAX= option within the range
of the Z variable values, the plot's data values are clipped at the
level that you specified.Default:Maximum value of Z variable
- ZMIN=minimum-value
- specifies the minimum value that is displayed on
a plot's Z axis. Defining the ZMIN=
value less than the minimum value in the input data set extends the
plot's Z axis. Defining the ZMIN= value greater than the minimum value
in the input data set displays all Z values in the range of ZMIN-to-ZMAX,
and might cause data clipping.
Default:The minimum value of the Z variable
Details
Description
Changing the Appearance of the Data Points
Use the COLOR=, SHAPE=,
and SIZE= options to change the appearance of your scatter plot or
to classify data using color, shape, size, or any combination of these
features. Scatter Plot Symbols illustrates the shape names that you can specify in the
SHAPE= option. To make all of the data points red balloons at twice
the normal size, use the following code:
scatter y*x=z /color="red" shape="balloon" size=2;