G3D Procedure

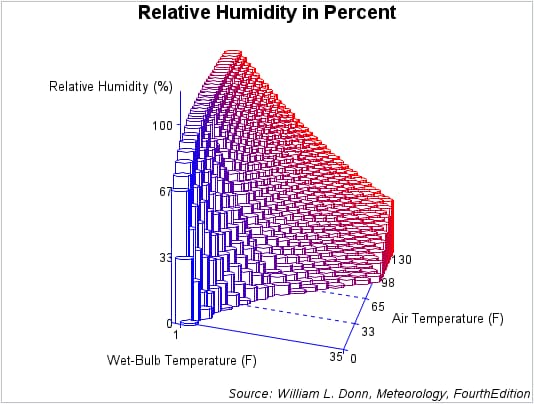
Example 7: Generating a Rotated Scatter Plot with Modified Axes
| Features: |
Scatter statement
|
This scatter plot
modifies the procedure defaults. It specifies a shape for the data
points and classifies the data by color. For the axes, it specifies
blue as the axis color. It specifies five major tick marks for the
Y axis and two major tick marks for the X axis. For the Z-axis, it
specifies five major tick marks, zero as the minimum axis value, and
one hundred as the maximum axis value. It also rotates the X-Y plane
–15 degrees around the perpendicular Z axis.
Program
goptions reset=all border;
title1 "Relative Humidity in Percent";
footnote1 j=r f="Albany AMT/it"
   "Source: William L. Donn, Meteorology, Fourth
Edition";
proc g3d data=sashelp.humid;
   scatter airtemp*bulbtemp=humidity/
       shape="pillar"
       color=colorvar
       caxis=blue
       rotate=-15
       yticknum=5
       xticknum=2
       zticknum=4
       zmin=0
       zmax=100;
run;
quit;