Overview: The Annotate Facility
Overview of the Annotate Facility
The Annotate
facility enables you to generate a special data set of graphics commands
from which you can produce graphics output. This data set is referred
to as an Annotate data set. You can generate
custom graphics by using an Annotate data set with GANNO or GSLIDE. You can enhance your graphics output
by applying an Annotate data set to graphics that you generated using
procedures such as GCHART, GCONTOUR, and GMAP, among others.
Enhancing Existing Graphs
The Annotate
facility enhances output from SAS/GRAPH procedures by adding graphics
elements to the output. For example, you can
Annotate Graphics Applied to a Map shows GMAP procedure output annotated with stars and labels
at selected cities.
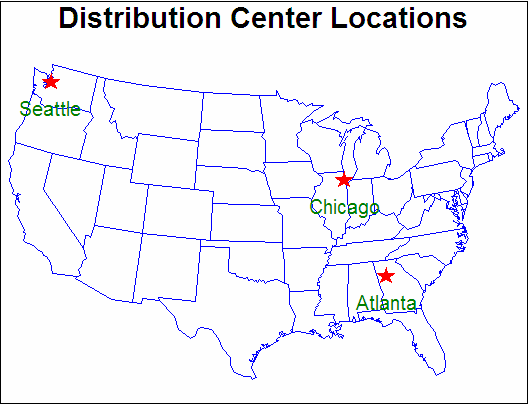
The program that creates
this output is in Labeling Cities on a Map.
Creating Custom Graphs
You can also use an
Annotate data set to create custom graphics. For example, you can
use Annotate graphics commands to
Custom Graphics Using Only Annotate Commands is an example of a custom graph that uses Annotate commands
to draw the graphics elements.
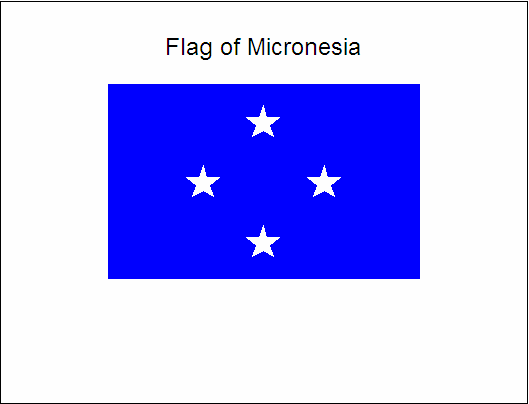
The program that creates
this output is in Drawing a Circle of Stars.
Creating Annotate Graphics
In order to create and
use Annotate graphics, you must first understand the structure and
functioning of the Annotate data set. For this information see About the Annotate Data Set. Once you understand the way the data set works, you can
follow these three steps to create Annotate graphics:
-
Determine what you want to draw, and where (location) and how (coordinate system) you want to position it on the graphics output. (See About Annotate Graphics.)
-
Build an Annotate data set of graphics commands using the Annotate variables and functions. (See Creating an Annotate Data Set.)
-
Submit a
SAS/GRAPH procedure to produce the graphics output. (See Producing Graphics Output from Annotate Data Sets.)