Examples
Example 1: Labeling Cities on a Map
| Features: |
|
| Sample library member: | GANCITY |
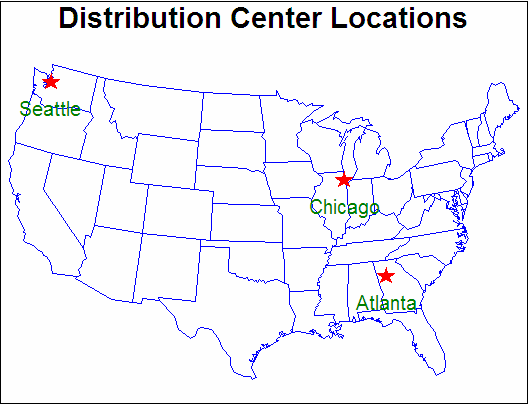
This example labels
a map of the continental United States with the location and names
of three cities. The GMAP procedure draws a map of the U.S. and an
Annotate data set adds the stars and labels.
The DATA step that creates
the Annotate data set gets the x and y coordinates of the
cities to be labeled from the MAPS.USCITY data set. Because MAPS.USCITY
stores projected coordinates in the X and Y variables, the DATA step
does not need to reassign the variable values. Also because X and
Y contain data values (the map data set coordinates), the XSYS and
YSYS variables specify coordinate system 2, absolute data values.
However, the HSYS variable that controls text height uses coordinate
system 3, percent of the graphics output area.
See Projecting an Annotate Data Set for an example of labeling a map using map coordinates
in units of latitude and longitude.
See GMAP Procedure for more information about using map data sets.
Program
goptions reset=all border;
data lower48;
   set maps.us;
   if state ne stfips("AK");
   if state ne stfips("HI");
   if state ne stfips("PR");
run;
data citystar;
   length function style color $ 8 position $ 1
          text $ 20;
   retain xsys ysys "2" hsys "3"
          when "a";
   set maps.uscity(keep=x y city state);
   if (city="Atlanta" and state=13)
       or city="Chicago"
       or city="Seattle";
   function="symbol"; style="marker"; text="V"; color="red"; size=5;
      output;
   function="label"; style=""; text=city; color="green";
      size=5; position="8"; output;
run;
title "Distribution Center Locations";
pattern value=mempty color=blue repeat=49;
proc gmap data=lower48 map=lower48;
   id state;
   choro state / annotate=citystar discrete nolegend;
run;
quit;
Program Description
data lower48;
   set maps.us;
   if state ne stfips("AK");
   if state ne stfips("HI");
   if state ne stfips("PR");
run;
Create the Annotate data set, CITYSTAR. CITYSTAR contains the commands that draw a star
and a label at each of the three cities. Setting WHEN to A draws the
annotation after the map.
data citystar;
   length function style color $ 8 position $ 1
          text $ 20;
   retain xsys ysys "2" hsys "3"
          when "a";
Include the values of selected variables from MAPS.USCITY. X and Y contain projected coordinates; CITY contains
names; STATE contains FIPS codes. Because there are several Atlantas,
a STATE value is necessary.
   set maps.uscity(keep=x y city state);
   if (city="Atlanta" and state=13)
       or city="Chicago"
       or city="Seattle";
Create the observation that draws the star. The text string V is the character code for the
star figure in the MARKER font assigned by the STYLE variable.
Example 2: Labeling Subgroups in a Vertical Bar Chart
| Features: |
Annotate Function: LABEL
|
| Sample library member: | GANVBAR |
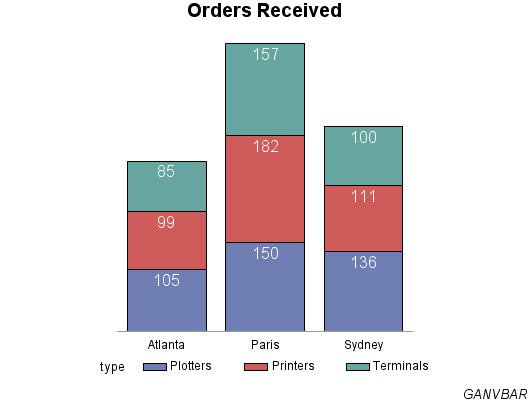
This example shows how to label subgroups in a vertical
bar chart that is generated by the GCHART procedure. Each bar represents
total orders for a city and is subgrouped by the type of order. The
Annotate facility labels each subgroup with the number of orders for
that category. The coordinates that position the subgroup labels are
derived from the values of the GCHART procedure variables CITY (the
chart (or midpoint) variable) and TYPE (the subgroup variable). These
variables are assigned to the corresponding Annotate variable.
See GCHART Procedure for more information about creating bar charts.
Program
goptions reset=all border;
data sold;
   length type $ 10;
   input city $ units type $ ;
   datalines;
Atlanta  99 Printers
Atlanta 105 Plotters
Atlanta  85 Terminals
Paris   182 Printers
Paris   150 Plotters
Paris   157 Terminals
Sydney  111 Printers
Sydney  136 Plotters
Sydney  100 Terminals
;
run;
data barlabel;
   length color style $ 8;
   retain color "white" when "a" style "arial"
      xsys ysys "2" position "E" size 4 hsys "3";
   set sold;
   midpoint=city;
   subgroup=type;
   text=left(put(units,5.));
run;
title "Orders Received";
footnote j=r "GANVBAR";
axis1 label=none major=none minor=none style=0
      value=none;
axis2 label=none;
proc gchart data=sold;
   vbar city / type=sum
               sumvar=units
               subgroup=type
               width=17
               raxis=axis1
               maxis=axis2
               annotate=barlabel;
run;
quit;
Program Description
data sold;
   length type $ 10;
   input city $ units type $ ;
   datalines;
Atlanta  99 Printers
Atlanta 105 Plotters
Atlanta  85 Terminals
Paris   182 Printers
Paris   150 Plotters
Paris   157 Terminals
Sydney  111 Printers
Sydney  136 Plotters
Sydney  100 Terminals
;
run;
data barlabel;
   length color style $ 8;
   retain color "white" when "a" style "arial"
      xsys ysys "2" position "E" size 4 hsys "3";
   set sold;
   midpoint=city;
   subgroup=type;
   text=left(put(units,5.));
run;Example 3: Drawing a Circle of Stars
| Features: |
|
| Sample library member: | GANCIRCL |
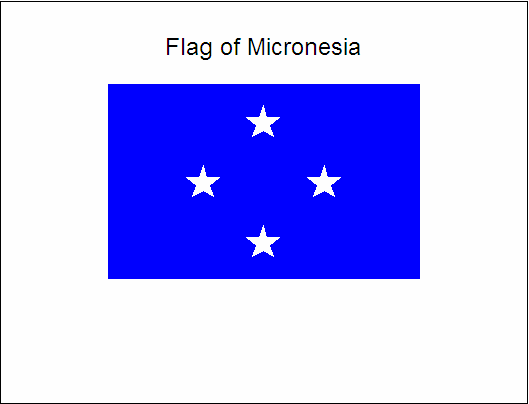
This example shows how
to use an Annotate data set to draw a flag that consists of a rectangle
and four stars. The stars are positioned by placing them on an imaginary
circle. The program uses the PIECNTR and PIEXY functions to find the
points on the circle and the CNTL2TXT programming function to transfer
coordinate values. It also processes Annotate assignment statements
in a DO loop. The GANNO procedure displays the Annotate graphics.
Program
goptions reset=all border;
data flag;
   length function style color $ 8 text $ 30;
   retain xsys ysys hsys "3";
function="frame"; output;
   function="label"; x=50; y=90; text="Flag of Micronesia";
      style=""; size=6; output;
   function="move"; x=20; y=30; output;
   function="bar"; x=80; y=80; color="blue";
      line=3; style="solid"; output;
do star_ang=0 to 270 by 90;
   function="piecntr"; x=50; y=55; size=15; output;
   function="piexy"; size=1; angle=star_ang; output;
   function="cntl2txt"; output;
   function="symbol"; style="marker"; text="V";
      angle=0; color="white"; size=10; x=.; y=.;
      output;
   end;
run;
proc ganno annotate=flag;
run;
quit;
Program Description
Create the Annotate data set, FLAG. XSYS, YSYS, and HSYS specify coordinate system 3,
absolute size of the graphics output area.
Draw a frame. The FRAME
function uses the default color BLACK to draw a frame around the graphics
output area specified by the XSYS and YSYS variables.
Draw the title. The LABEL
function draws the text specified in the TEXT variable. X and Y explicitly
position the title on the graphics output area.
Draw the background. MOVE
specifies the lower left corner of the rectangle that forms the flag.
BAR draws the rectangle using the values of X and Y for the upper
right corner. The LINE value of 3 fills the figure with the specified
color.
   function="move"; x=20; y=30; output;
   function="bar"; x=80; y=80; color="blue";
      line=3; style="solid"; output;
Draw the circle of stars. The DO loop repeats the processing instructions defined by the nested
assignment statements, placing a star every 90 degrees around the
circle. To increase the number of stars, reduce the size of the angle
between them and adjust the ending angle.
The PIECNTR function is set to the center of the rectangle. PIEXY calculates a point on the arc based on the
value of STAR_ANG and updates the internal coordinates XLAST and YLAST.
The programming function CNTL2TXT copies the values of
XLAST and YLAST to the text-handling coordinates XLSTT and YLSTT. Assigning missing values to X and Y forces the SYMBOL
function to use the values of XLSTT and YLSTT to position the star.
The text string V is the character code for the star figure in the
MARKER font assigned by the STYLE variable.