About the Annotate Data Set
Overview of Annotate Data Sets
In an
Annotate data set, each observation represents a command to draw a
graphics element or perform an action. The observations use a set
of predefined annotate variables. Annotate functions determine what is to be done with each observation. Annotate macros simplify the process of drawing a graphics
element. Annotate error messages are sent to the SAS log. For usage
information and example programs , refer to Using Annotate Macros and Using Annotate Data Sets.
The observations in an
Annotate data set use a set of predefined Annotate variables. The
values of the variables in the observation determine what is done
and how it is done. To create these observations, you assign values
to the variables either explicitly with a DATA step or implicitly
with Annotate macros. See Creating an Annotate Data Set.
Structure of an Annotate Data Set
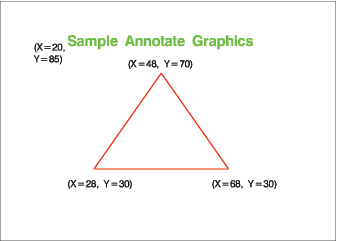
Listing of the Annotate Data Set TRIANGLE is an example of an Annotate data set called TRIANGLE.
The observations in this data set contain the commands that create
a text label, move to a point in the output, and draw a triangle.
(The DATA step that creates TRIANGLE is shown in Using the DATA Step.)
Listing of the Annotate Data Set TRIANGLE
  OBS   FUNCTION   X    Y   HSYS   XSYS   YSYS    STYLE    COLOR   POSITION  SIZE    LINE    TEXT

    1    label     20   85    3      3      3      swissb   green       6        6.0    .     Sample Annotate Graphics
    2    move      28   30    3      3      3      swissb   green       6        6.0    .     Sample Annotate Graphics
    3    draw      68   30    3      3      3      swissb   red         6        0.8    1     Sample Annotate Graphics
    4    draw      48   70    3      3      3      swissb   red         6        0.8    1     Sample Annotate Graphics
    5    draw      28   30    3      3      3      swissb   red         6        0.8    1     Sample Annotate Graphics
Note: A blank denotes a missing
value for a character variable. A '.' denotes a missing value for
a numeric variable.
Each observation in
this data set contains complete instructions for drawing a graphic
or moving to a position to draw a graphic. The value of the FUNCTION
variable determines what the observation does. Other variables control
how the function is performed. This list describes each observation
in the TRIANGLE and the task that it performs:
-
Create a label. This instruction draws a green label at position 20,85 (in X,Y coordinates). The value of the FUNCTION variable (LABEL) tells the program what to do. The values of the coordinate variables X and Y combined with the values of the coordinate system variables HSYS, XSYS, and YSYS tell where to do it. The values of the attribute variables STYLE, COLOR, TEXT, POSITION, and SIZE tell how to do it. These variables specify the font (SWISSB), the color and text of the label, the position of the label in relation to X and Y (centered on the point), and the size of the text.
-
Go to the starting point for the triangle. The value of the FUNCTION variable (MOVE) tells the program to go to the point specified by X and Y. This is the only instruction in the observation. Notice that the values of the variables specified for the first observation persist but are not used because they have no effect on the MOVE function.
Annotate Output from the TRIANGLE Data Set shows the green title and the red triangle produced by
the TRIANGLE data set and displayed with the GANNO procedure. Notes on the figure in black contain the X and
Y coordinates of the graphics elements.
Annotate Variables
Annotate variables have predefined
names. In each observation, the Annotate facility looks only for variables
with those names. Other variables can be present, but they are ignored.
Conceptually, there are three types of variables:
There is also an HTML
variable, which provides linking information when you want to use
the annotate data set to generate a drill-down graph that can be viewed
in a Web browser.
Summary of Annotate Variables lists all Annotate variables, grouped by task, and briefly
describes each one. See About the Annotate Variables for a complete description of each
variable.
Summary of Annotate Variables
|
specifies a drawing
or programming action; Summary of Graphics Tasks Performed by Annotate Functions describes these actions.
|
||
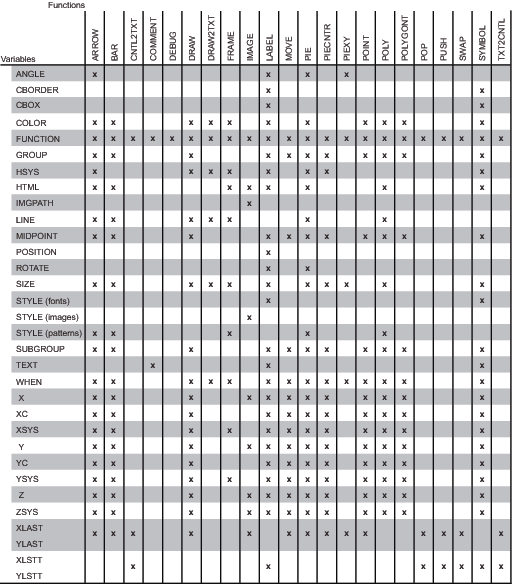
See Annotate Variables Used with Annotate Functions for a table that shows you which Annotate functions are
used with which Annotate variables.
Annotate Functions
The FUNCTION variable accepts a set
of predefined values (functions) that perform both graphics tasks
and programming tasks.
The graphics functions
draw the graphics elements that are illustrated in Graphics Elements.
The programming functions
control the internal coordinates, manipulate the LIFO stack, and help
you debug an Annotate data set. These programming functions are discussed
in Internal Coordinates, Using the LIFO Stack, and Debugging.
Summary of Graphics Tasks Performed by Annotate Functions summarizes the tasks that are performed by the Annotate
functions. See About the Annotate Functions for a complete description of the FUNCTION
variable and its values.
See Annotate Variables Used with Annotate Functions for a table that shows you which Annotate functions work
with which Annotate variables.