The X11 Procedure
- Overview
-
Getting Started

-
Syntax
-
DetailsHistorical Development of X-11Implementation of the X-11 Seasonal Adjustment MethodComputational Details for Sliding Spans AnalysisData RequirementsMissing ValuesPrior Daily Weights and Trading-Day RegressionAdjustment for Prior FactorsThe YRAHEADOUT OptionEffect of Backcast and Forecast LengthDetails of Model SelectionOUT= Data SetThe OUTSPAN= Data SetOUTSTB= Data SetOUTTDR= Data SetPrinted OutputODS Table Names
-
Examples
- References
Implementation of the X-11 Seasonal Adjustment Method
The following steps describe the analysis of a monthly time series using multiplicative seasonal adjustment. Additional steps used by the X-11-ARIMA method are also indicated. Equivalent descriptions apply for an additive model if you replace divide with subtract where applicable.
In the multiplicative adjustment, the original series  is assumed to be of the form
![\[ O_{t} = C_{t} S_{t} I_{t} P_{t} D_{t} \]](images/etsug_x110014.png)
where  is the trend cycle component,
  is the seasonal component,
  is the irregular component,
  is the prior monthly factors component, and
  is the trading-day component.
The trading-day component can be further factored as
![\[ D_{t} = D_{r,t} D_{tr,t}, \]](images/etsug_x110016.png)
where  are the trading-day factors derived from the prior daily weights, and
  are the residual trading-day factors estimated from the trading-day regression. For further information about estimating
trading day variation, see Young (1965).
are the residual trading-day factors estimated from the trading-day regression. For further information about estimating
trading day variation, see Young (1965).
Additional Steps When Using the X-11-ARIMA Method
The X-11-ARIMA method consists of extending a given series by an ARIMA model and applying the usual X-11 seasonal adjustment method to this extended series. Thus in the simplest case in which there are no prior factors or calendar effects in the series, the ARIMA model selection, estimation, and forecasting are performed first, and the resulting extended series goes through the standard X-11 steps described in the next section.
If prior factor or calendar effects are present, they must be eliminated from the series before the ARIMA estimation is done because these effects are not stochastic.
Prior factors, if present, are removed first. Calendar effects represented by prior daily weights are then removed. If there are no further calendar effects, the adjusted series is extended by the ARIMA model, and this extended series goes through the standard X-11 steps without repeating the removal of prior factors and calendar effects from prior daily weights.
If further calendar effects are present, a trading-day regression must be performed. In this case it is necessary to go through an initial pass of the X-11 steps to obtain a final trading-day adjustment. In this initial pass, the series, adjusted for prior factors and prior daily weights, goes through the standard X-11 steps. At the conclusion of these steps, a final series adjusted for prior factors and all calendar effects is available. This adjusted series is then extended by the ARIMA model, and this extended series goes through the standard X-11 steps again, without repeating the removal of prior factors and calendar effects from prior daily weights and trading-day regression.
The Standard X-11 Seasonal Adjustment Method
The standard X-11 seasonal adjustment method consists of the following steps. These steps are applied to the original data or the original data extended by an ARIMA model.
-
In step 1, the data are read, ignoring missing values until the first nonmissing value is found. If prior monthly factors are present, the procedure reads prior monthly
factors and divides them into the original series to obtain 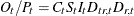 .
.
Seven daily weights can be specified to develop monthly factors to adjust the series for trading-day variation,
; these factors are then divided into the original or prior adjusted series to obtain  .
.
-
In steps 2, 3, and 4, three iterations are performed, each of which provides estimates of the seasonal
, trading-day , trend cycle , and irregular components . Each iteration refines estimates of the extreme values in the irregular components. After extreme values are identified
and modified, final estimates of the seasonal component, seasonally adjusted series, trend cycle, and irregular components
are produced. Step 2 consists of three substeps:
-
During the first iteration, a centered, 12-term moving average is applied to the original series
to provide a preliminary estimate  of the trend cycle curve . This moving average combines 13 (a 2-term moving average of a 12-term moving average) consecutive monthly values, removing
the and . Next, it obtains a preliminary estimate
of the trend cycle curve . This moving average combines 13 (a 2-term moving average of a 12-term moving average) consecutive monthly values, removing
the and . Next, it obtains a preliminary estimate  by
by
![\[ \widehat{S_{t}I_{t}} = \frac{O_{t}}{\hat{C}_{t}} \]](images/etsug_x110023.png)
-
A moving average is then applied to the
to obtain an estimate  of the seasonal factors. is then divided by this estimate to obtain an estimate
  of the irregular component. Next, a moving standard deviation is calculated from the irregular component and is used in assigning
a weight to each monthly value for measuring its degree of extremeness. These weights are used to modify extreme values in
. New seasonal factors are estimated by applying a moving average to the modified value of . A preliminary seasonally adjusted series is obtained by dividing the original series by these new seasonal factors. A second
estimate of the trend cycle is obtained by applying a weighted moving average to this seasonally adjusted series.
of the irregular component. Next, a moving standard deviation is calculated from the irregular component and is used in assigning
a weight to each monthly value for measuring its degree of extremeness. These weights are used to modify extreme values in
. New seasonal factors are estimated by applying a moving average to the modified value of . A preliminary seasonally adjusted series is obtained by dividing the original series by these new seasonal factors. A second
estimate of the trend cycle is obtained by applying a weighted moving average to this seasonally adjusted series.
-
The same process is used to obtain second estimates of the seasonally adjusted series and improved estimates of the irregular component. This irregular component is again modified for extreme values and then used to provide estimates of trading-day factors and refined weights for the identification of extreme values.
-
-
Using the same computations, a second iteration is performed on the original series that has been adjusted by the trading-day factors and irregular weights developed in the first iteration. The second iteration produces final estimates of the trading-day factors and irregular weights.
-
A third and final iteration is performed using the original series that has been adjusted for trading-day factors and irregular weights computed during the second iteration. During the third iteration, PROC X11 develops final estimates of seasonal factors, the seasonally adjusted series, the trend cycle, and the irregular components. The procedure computes summary measures of variation and produces a moving average of the final adjusted series.
Sliding Spans Analysis
The motivation for sliding spans analysis is to answer the question, When is a economic series unsuitable for seasonal adjustment? There have been a number of past attempts to answer this question: stable seasonality F test; moving seasonality F test, Q statistics, and others.
Sliding spans analysis attempts to quantify the stability of the seasonal adjustment process, and hence quantify the suitability of seasonal adjustment for a given series.
It is based on a very simple idea: for a stable series, deleting a small number of observations should not result in greatly different component estimates compared with the original, full series. Conversely, if deleting a small number of observations results in drastically different estimates, the series is unstable. For example, a drastic difference in the seasonal factors (Table D10) might result from a dominating irregular component or sudden changes in the seasonally component. When the seasonal component estimates of a series is unstable in this manner, they have little meaning and the series is likely to be unsuitable for seasonal adjustment.
Sliding spans analysis, developed at the Statistical Research Division of the U.S. Census Bureau (Findley et al. 1990; Findley and Monsell 1986), performs a repeated seasonal adjustment on subsets or spans of the full series. In particular, an initial span of the data, typically eight years in length, is seasonally adjusted, and the Tables C18, the trading-day factors (if trading-day regression performed), D10, the seasonal factors, and D11, the seasonally adjusted series are retained for further processing. Next, one year of data is deleted from the beginning of the initial span and one year of data is added. This new span is seasonally adjusted as before, with the same tables retained. This process continues until the end of the data is reached. The beginning and ending dates of the spans are such that the last observation in the original data is also the last observation in the last span. This is discussed in more detail in the following paragraphs.
The following notation for the components or differences computed in the sliding spans analysis follows Findley et al. (1990). The meaning for the symbol  is component X in month (or quarter) t, computed from data in the kth span. These components are now defined.
-
Seasonal Factors (Table D10):

-
Trading-Day Factors (Table C18):

-
Seasonally Adjusted Data (Table D11):

-
Month-to-Month Changes in the Seasonally Adjusted Data:

-
Year-to-Year Changes in the Seasonally Adjusted Data:

The key measure is the maximum percent difference across spans. For example, consider a series that begins in January 1972,
ends in December 1984, and has four spans, each of length 8 years (see Figure 1 in Findley et al. (1990), p. 346). Consider the seasonal factor (Table D10) for month t for span k, and let  denote the number of spans containing month t; that is,
![\[ N_{t} = \{ k: ~ span ~ k ~ contains ~ month ~ t \} \]](images/etsug_x110033.png)
In the middle years of the series there is overlap of all four spans, and will be 4. The last year of the series will have only one span, while the beginning can have 1 or 0 spans depending on the
original length.
Since we are interested in how much the seasonal factors vary for a given month across the spans, a natural quantity to consider is
![\[ max_{k{\epsilon }N_{t}}S_{t}(k) - min_{k{\epsilon }N_{t}}S_{t}(k) \]](images/etsug_x110034.png)
In the case of the multiplicative model, it is useful to compute a percentage difference; define the maximum percentage difference (MPD) at time t as
![\[ MPD_{t} = \frac{max_{k{\epsilon }N_{t}}S_{t}(k) - min_{k{\epsilon }N_{t}}S_{t}(k)}{min_{k{\epsilon }N_{t}}S_{t}(k) } \]](images/etsug_x110035.png)
The seasonal factor for month t is then unreliable if  is large. While no exact significance level can be computed for this statistic, empirical levels have been established by
considering over 500 economic series (Findley et al. 1990; Findley and Monsell 1986). For these series it was found that for four spans, stable series typically had less than 15% of the MPD values exceeding
3.0%, while in marginally stable series, between 15% and 25% of the MPD values exceeded 3.0%. A series in which 25% or more
of the MPD values exceeded 3.0% is almost always unstable.
is large. While no exact significance level can be computed for this statistic, empirical levels have been established by
considering over 500 economic series (Findley et al. 1990; Findley and Monsell 1986). For these series it was found that for four spans, stable series typically had less than 15% of the MPD values exceeding
3.0%, while in marginally stable series, between 15% and 25% of the MPD values exceeded 3.0%. A series in which 25% or more
of the MPD values exceeded 3.0% is almost always unstable.
While these empirical values cannot be considered an exact significance level, they provide a useful empirical basis for deciding if a series is suitable for seasonal adjustment. These percentage values are shifted down when fewer than four spans are used.