The TIMESERIES Procedure
- Overview
- Getting Started
-
Syntax

-
DetailsAccumulationMissing Value InterpretationTime Series TransformationTime Series DifferencingDescriptive StatisticsSeasonal DecompositionCorrelation AnalysisCross-Correlation AnalysisSpectral Density AnalysisSingular Spectrum AnalysisData Set OutputOUT= Data SetOUTCORR= Data SetOUTCROSSCORR= Data SetOUTDECOMP= Data SetOUTFREQ= Data SetOUTPROCINFO= Data SetOUTSEASON= Data SetOUTSPECTRA= Data SetOUTSSA= Data SetOUTSUM= Data SetOUTTREND= Data Set_STATUS_ Variable ValuesPrinted OutputODS Table NamesODS Graphics Names
-
Examples
- References
Example 39.5 Illustration of Singular Spectrum Analysis
This example illustrates the use of singular spectrum analysis.
The following statements extract two additive components from the SASHELP.AIR time series by using the THRESHOLDPCT= option to specify that the first component represent 80% of the variability in the
series. The resulting groupings, consisting of the first three and remaining nine singular value components, are presented
in Output 39.5.1 through Output 39.5.3.
title "SSA of AIR data";

proc timeseries data=sashelp.air plot=ssa;
   id date interval=month;
   var air;
   ssa / length=12 THRESHOLDPCT=80;
run;
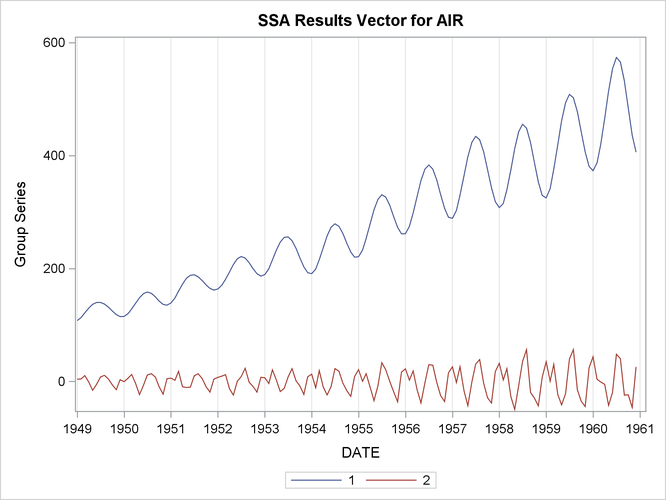
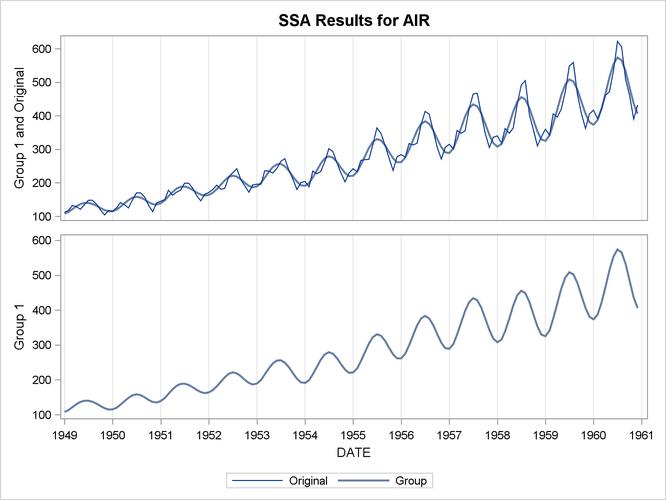
Output 39.5.1: Singular Value Grouping #1 Plot
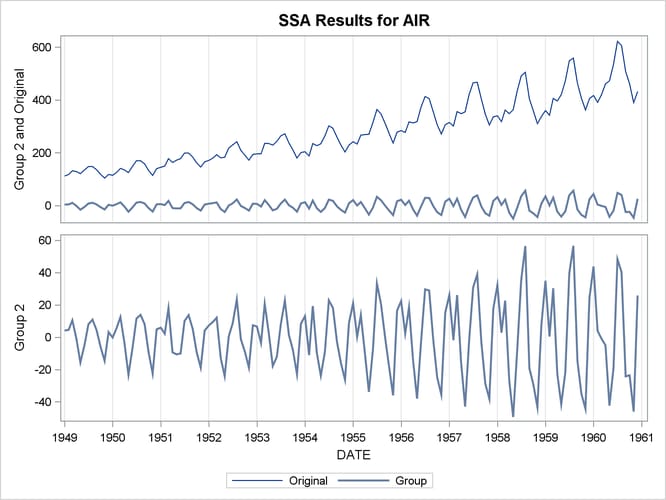
Output 39.5.2: Singular Value Grouping #2 Plot
Output 39.5.3: Singular Value Components Plot