Scatter Histogram

Definition

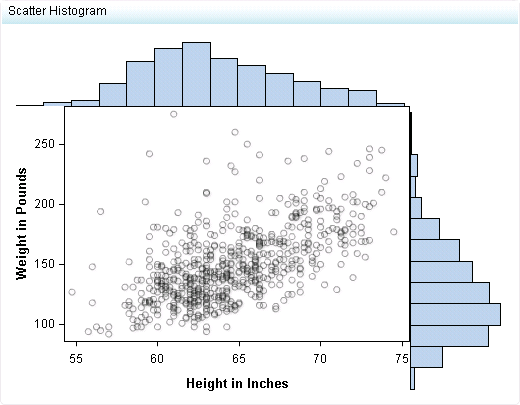
A scatter histogram is a type of scatter plot that has a horizontal and vertical histogram along the top and right side of the graph. The purpose of the horizontal and vertical bars is to show the frequency of the data points taken as columns and rows.
Example of a Scatter Histogram Indicator
example Scatter Histogram indicator
For a sample of the indicator data that was used to create this indicator, see “Sample Data Structure” for this indicator.

Usage Information

Data best suited for
Use a scatter histogram when it is necessary to display both individual data points and summaries of the points. An example of this might be test scores for a class over a range of six years. The individual test scores for each year can be displayed as data points on the graph itself, while the histogram displays the count of the scores in bar format.
Target audience
Most users will be unfamiliar with this indicator type. It is not recommended that you use this indicator type unless you are sure your audience knows how to interpret it, or you provide instructions on how to interpret it.
Data aggregation support
This indicator type does not aggregate the indicator data.
Range support
Ranges are not supported.
Alert support
Alerts are not supported.
Link support
This indicator type can be used to define a link or as the destination of a link.For more information about defining an indicator with a hyperlink, see Adding Links to Indicators or Other Content.
Interaction support
  • Data filter support: This indicator type can be used as either a source or target indicator.
  • Interactive highlighting support: This indicator type can be used as either a source or target indicator.
For more information, see Adding Interactions between Indicators.
Filter multiple items support
Filtering multiple items is supported.For more information, see Supporting Multiple Selections in a Filtered Data Interaction.

General Settings

The General Settings section provides controls that support the following tasks:

Display Settings

The following display settings are used in the preceding figure. For more information, see “Sample Data Structure” for this indicator.
Display Setting
Selection Used for Figure
X-axis value
Height
Y-axis value
Weight
X-axis title
Set to Height in Inches
Y-axis title
Set to Weight in Pounds
Scale X axis
This setting is selected.
Scale Y axis
This setting is selected.
You can customize the following display settings for this indicator:
  • (Required) From the X-axis value list, select the column in your data that you want to use for the X-axis value in the indicator. When you view your indicator data, the columns in the data set are described by the values in the Column Name column. The selections available in the X-axis value list are all of the values in the Column Name column.
  • (Required) From the Y-axis value list, select the column in your data that you want to use for the Y-axis value in the indicator. When you view your indicator data, the columns in the data set are described by the values in the Column Name column. The selections available in the Y-axis value list are all of the values in the Column Name column.
  • In the X-axis title field, type the title to use for the X axis in the indicator. If you do not specify a title, the value that you selected from the X-axis value list is used by default. If you do not want a title, type a space in the field. If you select Scale X axis, a measurement label is added to the title.
  • In the Y-axis title field, type the title to use for the Y axis in the indicator. If you do not specify a title, the value that you selected from the Y-axis value list is used by default. If you do not want a title, type a space in the field. If you select Scale Y axis, a measurement label is added to the title.
  • Select Scale X axis if you want to scale that axis. When you make this selection, a measurement label is added to the X-axis title if the data is numeric. For example, if the X-axis title is set to Revenue and you select Scale X axis, the X-axis title is displayed as Revenue (millions).
  • Select Scale Y axis if you want to scale that axis. When you make this selection, a measurement label is added to the Y-axis title if the data is numeric. For example, if the Y-axis title is set to Revenue and you select Scale Y axis, the Y-axis title is displayed as Revenue (millions).

Sample Data Structure

To create a scatter histogram, you must provide two measures (X-axis value and Y-axis value).
Tip
This indicator does not provide many display settings that can cluster or group data. Therefore, make sure that the indicator data is aggregated to produce a meaningful representation of data.
The following data sample is associated with the figure previously shown. Underneath each column heading is its associated display setting.
Height
(X-axis value)
Weight
(Y-axis value)
54.75
127.00
55.75
94.00
58.00
131.00