In addition to changing the tile positions or color, the TileChartModel can be used to change other general display properties. For example, you can use it to change tile labels or the text attributes of those labels, or to get the chart's LegendModel and move the legend or change its text.
The following code fragment sets red text for the tile labels on a TileChart's first detail level:
javax.swing.table.TableModel tableModel = <...>;  // some TableModel data
TileChartTableDataModel dataModel = new TileChartTableDataModel(tableModel);

// Create a TileChart
   TileChart tileChart = new TileChart(dataModel);

// Define a text style with red text
   AdvancedTextStyle textStyle = new AdvancedTextStyle();
   textStyle.setColor(Color.red);

// Get the chart's graph model and set the red text on the tile labels
   TileChartModel graphModel = tileChart.getGraphModel();
   graphModel.setTileLabelStyle(textStyle, 1);
Rather than changing individual properties, it may be easier to use the TileChart to set a graph style, which makes it easier to manage multiple display properties.
A TileChartModel can be used to modify the line style (color, width, visibility, ...) of the edges around the tiles of any detail level. This is useful for emphasizing the tiles at a particular detail level or enhancing the delineation of tiles across multiple levels.
To change the tile lines, define the desired LineStyle, and then call the TileChartModel's putOutlineLineStyle() method to set the LineStyle on the chart. The putOutlineLineStyle() method takes two arguments: the LineStyle, and a number that identifies the detail level that will use the line style.
The following code fragment sets a 4-pixel line width for the edges around level one tiles and a 2-pixel line width for edges around level two tiles:
javax.swing.table.TableModel tableModel = <...>;  // some TableModel data
TileChartTableDataModel dataModel = new TileChartTableDataModel(tableModel);

// Create a TileChart
   TileChart tileChart = new TileChart(dataModel);

// Create two new LineStyle definitions
   LineStyle levelOne=new LineStyle(
     Color.black,
     new BaseLength(4, "px"),
     GraphConstants.TRUE);
   LineStyle levelTwo=new LineStyle(
     Color.black,
     new BaseLength(2, "px"),
     GraphConstants.TRUE);

// Set the line styles on the chart
   TileChartModel graphModel=tileChart.getGraphModel();
   graphModel.putOutlineLineStyle(levelOne, 1);
   graphModel.putOutlineLineStyle(levelTwo, 2);
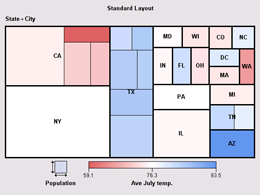
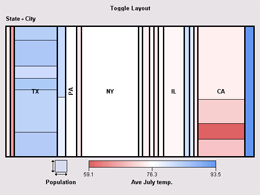
A TileChartModel supports several different tile layouts for representing the data within the graph area. The default layout generally orders tiles by size, while the other layouts order tiles by data values. The layout types generate different looks for the graph, and the type of data being shown may lend itself well to one or the other of the layout types. For example, Tile variables with a date or time type look better when ordered logically by the data values, so the toggle or flow layouts might yield a better display than the default layout. All layouts are performed recursively for each level of the specified Tile variables.
A TileChartModel supports the following layout types:
|
|
|
|

|
|
|
|
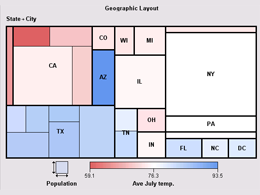
The following code fragment sets the LAYOUT_GEOGRAPHIC layout type to the chart and uses latitude and longitude coordinates to map the chart tiles:
javax.swing.table.TableModel tableModel = <...>;  // some TableModel data
TileChartTableDataModel dataModel = new TileChartTableDataModel(tableModel);

// Create a TileChart and set the chart layout
   TileChart tileChart = new TileChart(dataModel);
   TileChartModel graphModel=tileChart.getGraphModel();
   graphModel.setLayoutType(TileChartModel.LAYOUT_GEOGRAPHIC);

// Assign geographic variable roles
   dataModel.setYVariable(
     new AnalysisVariable("Latitude"));
   dataModel.setXVariable(
     new AnalysisVariable("Longitude"));
By default, a Tile chart's colors are determined by the ColorScheme of the GraphStyle that is in effect for the chart. You can use the TileChartModel as follows to change a chart's colors:
The setColorPaletteType() method takes a single argument, which must be one of the following GraphConstants field values:
COLOR_PALETTE_TWO_COLOR_CONTINUOUSCOLOR_PALETTE_THREE_COLOR_CONTINUOUSCOLOR_PALETTE_COLOR_SPECTRUMFor example, the following code fragment sets a two-color continuous palette and then sets light gray as the palette's starting color and dark gray as its ending color.
// Get the chart's graph model
   TileChartModel graphModel = tileChart.getGraphModel();

// Set an alternative color palette for the chart
   graphModel.setColorPaletteType(GraphConstants.COLOR_PALETTE_TWO_COLOR_CONTINUOUS);
   graphModel.getDataElementStyles().setContinuousFillTwoColorStartColor(Color.lightGray);
   graphModel.getDataElementStyles().setContinuousFillTwoColorEndColor(Color.darkGray);
For a palette with more than three colors or non-evenly distributed colors, set the COLOR_PALETTE_COLOR_SPECTRUM palette type and create a ColorPosition object to set the colors and their inflection points along the color spectrum, which is defined along a normalized range of 0 to 1 (inclusive). For example, the following code fragment specifies four colors for the spectrum and sets inflection points at positions 0.0, 0.35, 0.5, and 1.0:
// Get the chart's graph model
   TileChartModel graphModel = tileChart.getGraphModel();

// Set an alternative color palette for the chart
   graphModel.setColorPaletteType(GraphConstants.COLOR_PALETTE_COLOR_SPECTRUM);

   ColorPosition cp[] = {
     new ColorPosition(new Color(204,153,102), 0.0),
     new ColorPosition(new Color(255,255,153), 0.35),
     new ColorPosition(new Color(204,204,153), 0.5),
     new ColorPosition(new Color(102,153,102), 1.0)
   };
   graphModel.getDataElementStyles().setContinuousColorSpectrum(cp);
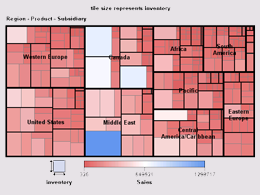
By default, a tile chart displays tiles to represent the values of all of the variables listed for the Tile role, and the tiles reflect the hierarchical relationship among the Tile values.
For example, assume a data model that represents sales data and assigns three variables to the Tile role: Region, Product, and Subsidiary. A TileChart for this data model would display one tile for each region. Within each region's tile there would be one tile for each product that is sold in the region, and within each product's tile there would be one tile for each subsidiary that sells the product. This chart has three detail levels: Region is at level 1, Product at level 2, and Subsidiary at level 3.
Although a TileChart always contains one detail level for each Tile variable, you can limit the number of levels that are displayed in the chart tiles by calling the TileChartModel's setDetailLevel() method. The setDetailLevel() method takes a single argument: the number of levels to display. For example, setDetailLevel(2) specifies that only the top two detail levels will be represented by the tiles in the chart. The setting only affects the chart display; it does not affect or limit the user's ability to drill down to all of the detail levels that are present in the data model.
The following code fragment limits the tile display to two detail levels:
javax.swing.table.TableModel tableModel = <...>;  // some TableModel data
TileChartTableDataModel dataModel = new TileChartTableDataModel(tableModel);

// Create a TileChart
   TileChart tileChart = new TileChart(dataModel);

// Limit the tile display to 2 detail levels
   TileChartModel graphModel=tileChart.getGraphModel();
   graphModel.setDetailLevel(2);
TileChartModel properties are bound properties. Modifying a property triggers a PropertyChangeEvent. The TileChart asynchronously updates when a PropertyChangeEvent is received from the TileChartModel. Similarly, modifying a property in any of the TileChartModel's contained models triggers a PropertyChangeEvent. A PropertyChangeEvent from contained models will bubble up to cause a PropertyChangeEvent to be fired from the TileChartModel.
For example, the following call
tileChartModel.getColorLegendModel().getValueTextStyle().setColor(java.awt.Color.yellow);
would cause the legend's value text style model to fire a "color" PropertyChangeEvent, causing legend model to fire a "valueTextStyle" PropertyChangeEvent, causing the TileChartModel to fire a "colorLegendModel" PropertyChangeEvent. This bubbling up of events enables the graph or any other listener to manage updates at a higher level of containment.