<%// ChangeTileLayout:%>
<%
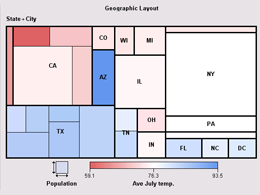
// To change the chart layout, call the TileChartModel's setLayoutType() method.
// This example specifies LAYOUT_GEOGRAPHIC, which requires positioning variables.
// The positioning variables in this case are the longitude and latitude
// coordinates of the cities in the data.
%>
<%@page import="com.sas.graphics.components.tilechart.TileChart,
com.sas.graphics.components.tilechart.TileChartModel,
com.sas.graphics.components.tilechart.TileChartTableDataModel,
com.sas.graphics.components.AnalysisVariable,
com.sas.graphics.components.GraphConstants,
com.sas.graphics.components.ClassificationVariable,
com.sas.graphics.components.ClassificationVariableList,
javax.swing.table.DefaultTableModel"
%>
<%
// Create a TileChart and a data source
TileChart tileChart=new TileChart();
%>
<%@ include file="GeographicData.jsp" %>
<%
// Set the chart layout
TileChartModel graphModel=tileChart.getGraphModel();
graphModel.setLayoutType(TileChartModel.LAYOUT_GEOGRAPHIC);
// Create a data model and attach the data source
TileChartTableDataModel dataModel=
new TileChartTableDataModel();
dataModel.setModel(dataTable);
// Define multiple Classification variables
ClassificationVariableList multiTile=new ClassificationVariableList(
new ClassificationVariable[] {
new ClassificationVariable("State", GraphConstants.SORT_DESCENDING),
new ClassificationVariable("City", GraphConstants.SORT_DESCENDING)
} );
// Assign the classification list to the Tile variable role
dataModel.setTileVariable(multiTile);
// Assign the Size variable role
dataModel.setSizeVariable(
new AnalysisVariable("Population"));
// Assign the Color variable role
dataModel.setColorVariable(
new AnalysisVariable("Ave July temp."));
// Assign geographic variable roles
dataModel.setYVariable(
new AnalysisVariable("Latitude"));
dataModel.setXVariable(
new AnalysisVariable("Longitude"));
// Assign the data model to the TileChart
tileChart.setDataModel(dataModel);
// Assign a title
tileChart.getTitle1().setText("Geographic Layout");
// Set HTTP-specific response and request functionality
tileChart.setResponse(response);
tileChart.setRequest(request);
// Set a graph size and write the chart to the display
tileChart.setWidth(600);
tileChart.setHeight(450);
tileChart.write(out);
%>