<%// SetDetailLevel:%>
<%
// To set the number of detail levels to display in the chart, call the
// TileChartModel's setDetailLevel() method. Be sure to call it after
// the data model has been attached to the chart.
//
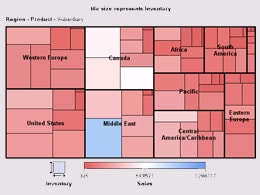
// In this example, 3 levels of detail are defined in the data model,
// but the TileChartModel is set to display only 2 of the levels.
%>
<%@page import="com.sas.servlet.tbeans.graphics.html.TileChart,
com.sas.graphics.components.tilechart.TileChartModel,
com.sas.graphics.components.tilechart.TileChartTableDataModel,
com.sas.graphics.components.LineStyle,
com.sas.graphics.components.GraphConstants,
com.sas.measures.BaseLength,
com.sas.graphics.components.AnalysisVariable,
com.sas.graphics.components.ClassificationVariable,
com.sas.graphics.components.ClassificationVariableList,
javax.swing.table.DefaultTableModel"
%>
<%
// Create a TileChart
TileChart tileChart=new TileChart();
%>
<%@ include file="SalesData.jsp" %>
<%
// Create a data model and attach the data source
TileChartTableDataModel dataModel=
new TileChartTableDataModel();
dataModel.setModel(dataTable);
// Define multiple Classification variables
ClassificationVariableList multiTile=new ClassificationVariableList(
new ClassificationVariable[] {
new ClassificationVariable("Region"),
new ClassificationVariable("Product"),
new ClassificationVariable("Subsidiary")
} );
// Assign the classification list to the Tile variable role
dataModel.setTileVariable(multiTile);
// Assign the Size variable role
dataModel.setSizeVariable(
new AnalysisVariable("Inventory"));
// Assign the Color variable role
dataModel.setColorVariable(
new AnalysisVariable("Sales"));
// Assign the data model to the TileChart
tileChart.setDataModel(dataModel);
// Set the number of detail levels to display
TileChartModel graphModel=tileChart.getGraphModel();
graphModel.setDetailLevel(2);
// Set a graph title
tileChart.getTitle1().setText("tile size represents Inventory");
// Set HTTP-specific response and request functionality
tileChart.setResponse(response);
tileChart.setRequest(request);
// Set a graph size and write the chart to the display
tileChart.setWidth(600);
tileChart.setHeight(450);
tileChart.write(out);
%>