<%// ChangeColorPalette:%>
<%
// By default, a Tile chart's colors are determined by the ColorScheme
// of the GraphStyle that is in effect for the chart. You can use the
// TileChartModel as follows to change a chart's colors:
// - Call setColorPaletteType() to set a palette type for the colors
// - Call getDataElementStyles() and use the returned object to specify colors
//
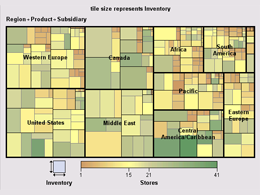
// This example sets a COLOR_PALETTE_COLOR_SPECTRUM palette type, which
// uses a ColorPosition object to set the colors and their inflection points
// along the color spectrum.
%>
<%@page import="com.sas.servlet.tbeans.graphics.html.TileChart,
com.sas.graphics.components.tilechart.TileChartModel,
com.sas.graphics.components.GraphConstants,
com.sas.graphics.components.ColorPosition,
com.sas.graphics.components.tilechart.TileChartTableDataModel,
com.sas.graphics.components.AnalysisVariable,
com.sas.graphics.components.ClassificationVariable,
com.sas.graphics.components.ClassificationVariableList,
java.awt.Color,
javax.swing.table.DefaultTableModel"
%>
<%
// Create a TileChart and a data source
TileChart tileChart=new TileChart();
%>
<%@ include file="SalesData.jsp" %>
<%
// Get the chart's graph model
TileChartModel graphModel = tileChart.getGraphModel();
// Set an alternative color palette for the chart
graphModel.setColorPaletteType(GraphConstants.COLOR_PALETTE_COLOR_SPECTRUM);
ColorPosition cp[] = {
new ColorPosition(new Color(204,153,102), 0.0),
new ColorPosition(new Color(255,255,153), 0.35),
new ColorPosition(new Color(204,204,153), 0.5),
new ColorPosition(new Color(102,153,102), 1.0)
};
graphModel.getDataElementStyles().setContinuousColorSpectrum(cp);
// Create a data model and attach the data source
TileChartTableDataModel dataModel=
new TileChartTableDataModel();
dataModel.setModel(dataTable);
// Define multiple Classification variables
ClassificationVariableList multiTile=new ClassificationVariableList(
new ClassificationVariable[] {
new ClassificationVariable("Region"),
new ClassificationVariable("Product"),
new ClassificationVariable("Subsidiary")
} );
// Assign the classification list to the Tile variable role
dataModel.setTileVariable(multiTile);
// Assign the Size variable role
dataModel.setSizeVariable(
new AnalysisVariable("Inventory"));
// Assign the data model to the TileChart
tileChart.setDataModel(dataModel);
// Set a graph title
tileChart.getTitle1().setText("tile size represents Inventory");
// Set HTTP-specific response and request functionality
tileChart.setResponse(response);
tileChart.setRequest(request);
// Set a graph size and write the chart to the display
tileChart.setWidth(600);
tileChart.setHeight(450);
tileChart.write(out);
%>