Usage Note 70009: Models for binary events measured in discrete intervals
 |  |  |
When the single occurrence of a binary event to a study subject can only be measured within a discrete interval of time, it is often of interest to estimate the probability of the event (or nonevent) occurring as a function of time. For example, in survival studies, the event is usually death and a goal is to estimate the survival curve showing the probability of survival over time. A common issue in such studies is that the event might not occur for some study subjects before the total time allotted for the study expires. Such cases are said to be right censored.
A similar problem could occur when the event is observed only in one of a set of discrete, adjacent intervals in space. For example, a study on the resilience of mobile devices over a course might observe failure only within distance intervals rather than precisely. Similarly, some devices might complete the course without failure and be considered right censored.
In these studies, a precise measure of time (or distance) is not available, so that two or more subjects experiencing the event within the same interval are assigned the same time (or distance) regardless of their unknown difference within the interval.
Model for Right Censored Data
A model for such events is the proportional hazard model for interval censored data, which can be fit using the ICPHREG procedure. The model can also be fit using the LOGISTIC procedure owing to its equivalence to a complementary log-log linked model on a binary response. This equivalence is discussed and illustrated in the example titled "Complementary Log-Log Model for Interval-Censored Survival Times" in the LOGISTIC procedure documentation. However, the model is most easily fit using PROC ICPHREG and this is illustrated below using the same data as in the PROC LOGISTIC example. The data contain the time to death of a set of beetles exposed to various concentrations of an insecticide. The time to death is measured only in discrete days with the study lasting for a total of 13 days.
The following statements create the data set and are the same as in the PROC LOGISTIC example. Note that the sex of each beetle and the concentration it is exposed to are recorded and are to be used as predictors in the model. All beetles indicated at day 14 survived the full 13 days of the study and can be considered right censored:
     data Beetles(keep=time sex conc freq);
        input time m20 f20 m32 f32 m50 f50 m80 f80;
        conc=.20; freq= m20; sex=1; output;
                  freq= f20; sex=2; output;
        conc=.32; freq= m32; sex=1; output;
                  freq= f32; sex=2; output;
        conc=.50; freq= m50; sex=1; output;
                  freq= f50; sex=2; output;
        conc=.80; freq= m80; sex=1; output;
                  freq= f80; sex=2; output;
        datalines;
      1   3   0  7  1  5  0  4  2
      2  11   2 10  5  8  4 10  7
      3  10   4 11 11 11  6  8 15
      4   7   8 16 10 15  6 14  9
      5   4   9  3  5  4  3  8  3
      6   3   3  2  1  2  1  2  4
      7   2   0  1  0  1  1  1  1
      8   1   0  0  1  1  4  0  1
      9   0   0  1  1  0  0  0  0
     10   0   0  0  0  0  0  1  1
     11   0   0  0  0  1  1  0  0
     12   1   0  0  0  0  1  0  0
     13   1   0  0  0  0  1  0  0
     14 101 126 19 47  7 17  2  4
     ;
The syntax of the response in PROC ICPHREG specifies two variables that define the start and end of each interval. The TIME variable created above contains the ending time of each interval. The following statements add the TIME0 variable, which provides the interval starting time and is simply the ending time minus one so that time intervals are (0,1), (1,2), ... , (12,13), and (13,∞), where ∞ is represented by a missing value:
     data b2;
       set beetles;
       time0=time-1;
       if time=14 then time=.;
       run;
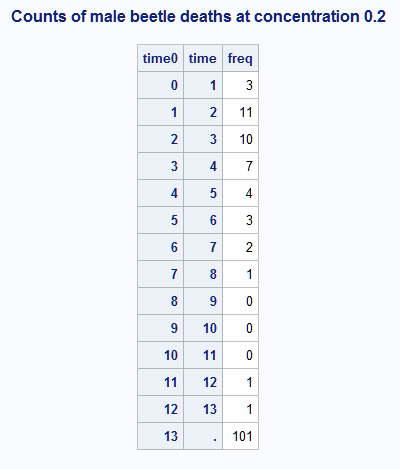
These statements display a portion of data set B2 showing the number of deaths in each time interval for male beetles exposed to the 0.2 concentration:
     proc print;
       where sex=1 and conc=0.2;
       id time0 time;
       var freq;
       title "Counts of male beetle deaths at concentration 0.2";
       run;
 |
The data represent eight distinct populations defined by the combinations of sex and concentration. A separate survival curve is to be estimated for each. The survival curves for four of the populations, those at lowest and highest concentrations, will be saved and plotted. To save and/or plot the survival estimates, a data set of the four combinations must be created for use in the BASELINE statement in PROC ICPHREG. The following statements create data set BASE defining the four populations to be saved and plotted. For labeling purposes, a variable, SEXCONC, is created that combines the sex and concentration values:
     proc freq data=b2;
        table sex*conc / out=base;
        run;
     data base; set base;
        where conc in (0.2, 0.8);
        sexchar='Female';
        if sex=1 then sexchar='Male';
        sexconc=catx(' ',sexchar,conc);
        run;
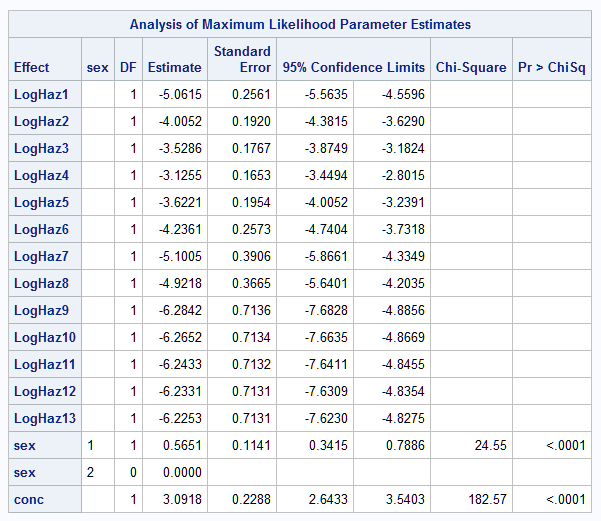
There are various ways to parameterize the model. The model fit in the PROC LOGISTIC example uses a piecewise constant hazard baseline function for the discrete intervals. This can be done in PROC ICPHREG using the BASE=PIECEWISE option and the intervals are specified using the INTERVALS= suboption. The HAZSCALE=LOGHAZ option applies the log transformation to the parameters of the baseline hazard function. The PLOTS=SURV option plots the survival curves for the populations specified in the COVARIATES= data set and are identified in the plot by the ROWID= variable. The SURVIVAL=SURV option names the variable containing the survival estimates saved in the OUT= data set, PwSurv:
     proc icphreg data=b2 plots=surv;
        freq freq;
        class sex / param=glm;
        model (time0,time) = sex conc /
           base=piecewise(intervals=(1 to 12)) hazscale=loghaz;
        baseline covariates=base survival=surv out=PwSurv / rowid=sexconc;
        run;
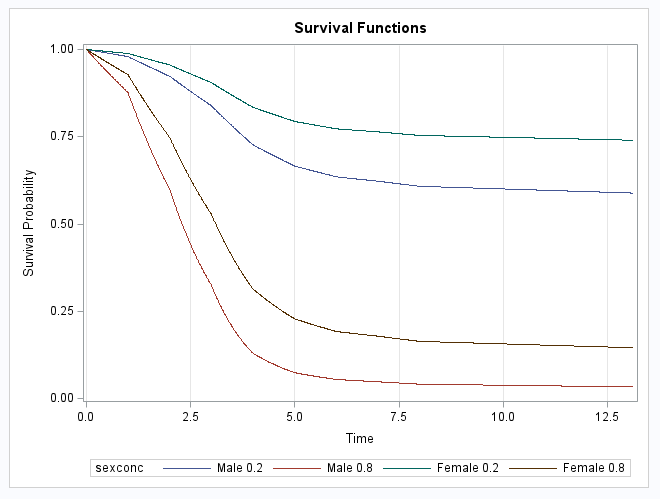
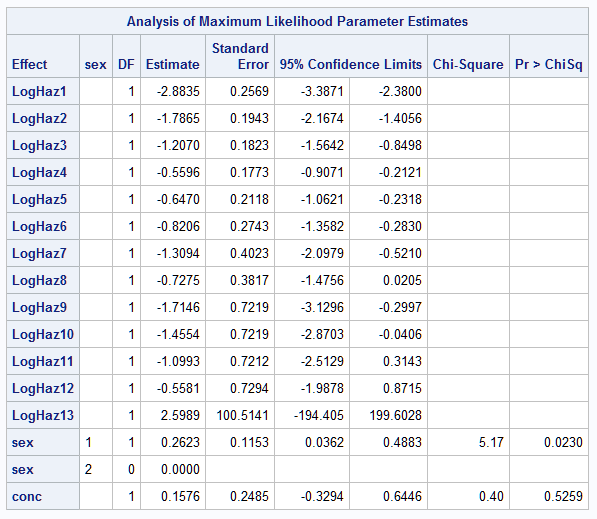
The above statements fit the model and produce the same model parameters as seen in the example in the LOGISTIC documentation. The plot is identical to the plot shown in the LOGISTIC documentation example:
  |
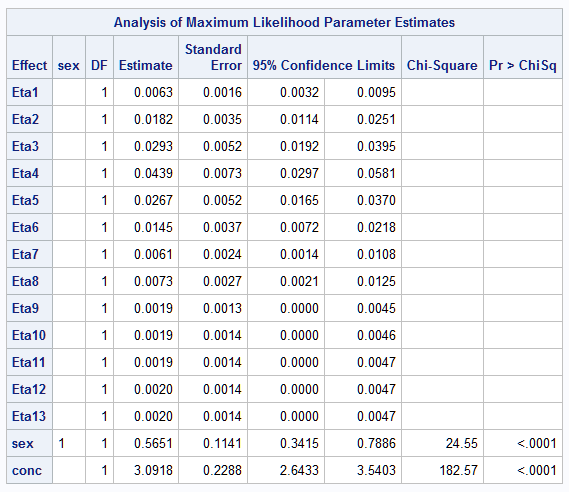
The somewhat simpler specification of the model used below parameterizes the baseline survival function as a discrete function with jumps occurring only at the discrete times:
     proc icphreg data=b2 plots=surv;
        freq freq;
        class sex / param=glm;
        model (time0,time) = sex conc / base=discrete;
        baseline covariates=base survival=surv out=DiscSurv / rowid=sexconc;
        run;
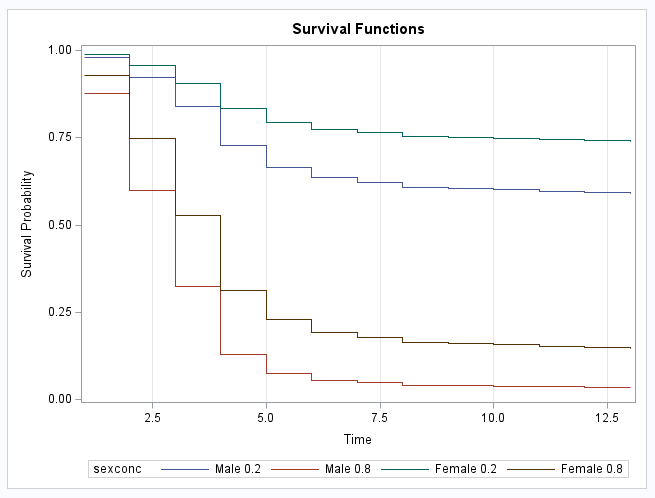
The stepped nature of the discrete survival curves shows the jumps implied by the BASE=DISCRETE option:
  |
The plots of the survival curves can be reproduced or modified if desired using the data sets saved by the BASELINE statements. The following statements reproduce the survival curves (not shown) estimated by the above models:
     proc sgplot data=PwSurv;
        pbspline y=surv x=time / group=sexconc;
        yaxis grid; xaxis grid;
        title "Survival curves for concentrations 0.2 and 0.8";
        title2 "BASE=PIECEWISE";
        run;
     proc sgplot data=DiscSurv;
        step y=surv x=time / group=sexconc;
        yaxis grid; xaxis grid;
        title "Survival curves for concentrations 0.2 and 0.8";
        title2 "BASE=DISCRETE";
        run;
Model for Uncensored Data
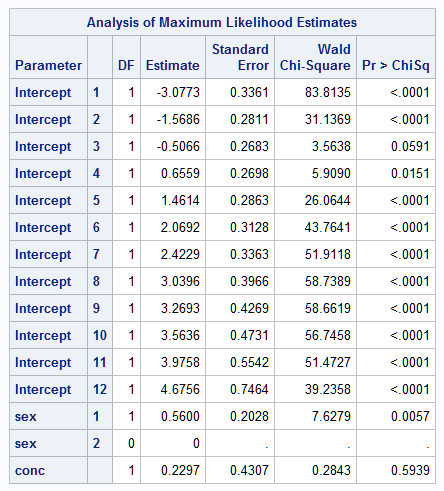
If all subjects in the study experience the event in one of the intervals, then there is no censoring. In that case, it might be reasonable to treat the numerically-valued interval variable as an ordinal categorical response that can be modeled using a cumulative logistic model. That model can be fit using the LOGISTIC and other procedures. The cumulative logistic model cannot accommodate censoring and should not be used when some subjects are censored.
To illustrate, suppose that all beetles in the above data set die on or before day 13. This can be created by omitting the TIME=14 observations. These statements fit the cumulative logistic model and save the cumulative predicted probabilities of death at each day. These are converted to survival probabilities by subtracting them from one. Since the saved probabilities are the same for each value of TIME, only the TIME=1 observations are retained and are further subset to include only the 0.2 and 0.8 concentrations as before. The _LEVEL_ variable that PROC LOGISTIC includes in the output data set indicates the time interval and is renamed TIME. The same SEXCONC variable as above is created for labeling purposes:
     proc logistic data=beetles;
        where time < 14;
        class sex / param=glm;
        freq freq;
        model time=sex conc;
        output out=logout(where=(conc in (0.2, 0.8) and time=1)) p=p;
        run;
     data logout; set logout;
        survp=1-p;
        time=_level_;
        sexchar='Female'; if sex=1 then sexchar='Male';
        sexconc=catx(' ',sexchar,conc);
        run;
     proc sort data=logout;
        by sex conc time;
        run;
 |
The proportional hazards model can also be fit to the uncensored data. The WHERE statement removes the right censored observations. The survival probabilities from both models are combined in data set COMP and then plotted for each sex and concentration combination using PROC SGPANEL:
     proc icphreg data=b3;
        where time0 < 13;
        freq freq;
        class sex / param=glm;
        model (time0,time) = sex conc /
           base=piecewise(intervals=(1 to 12)) hazscale=loghaz;
        baseline covariates=base survival=surv out=PHout / rowid=sexconc;
        run;
     data comp; merge PHout logout;
        by sex conc time;
        keep sex conc sexconc time surv survp;
        run;
     proc sgpanel noautolegend;
        panelby sexconc / novarname;
        pbspline y=surv x=time / name='PH' legendlabel='Prop. Hazards';
        pbspline y=survp x=time / name='CL' legendlabel='Cumulative Logit';
        keylegend 'PH' 'CL';
        run;
 |
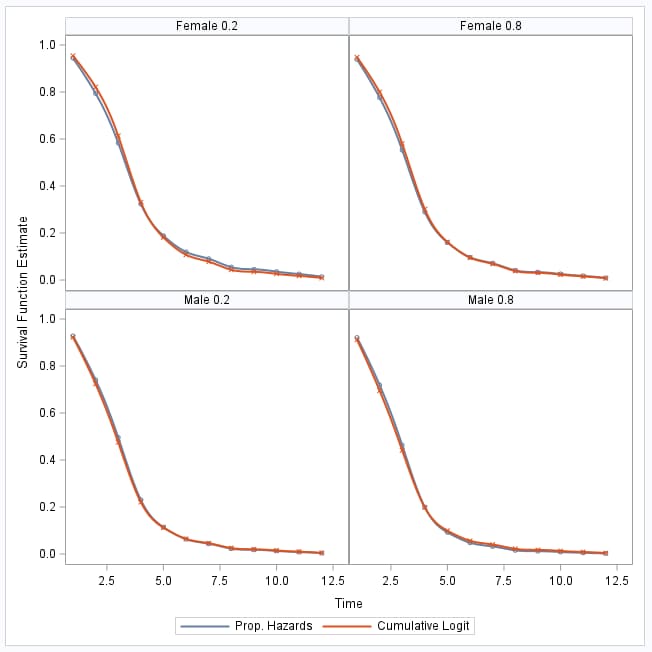
Notice that the survival curves from the cumulative logistic model are very similar to those from the proportional hazards model:
 |
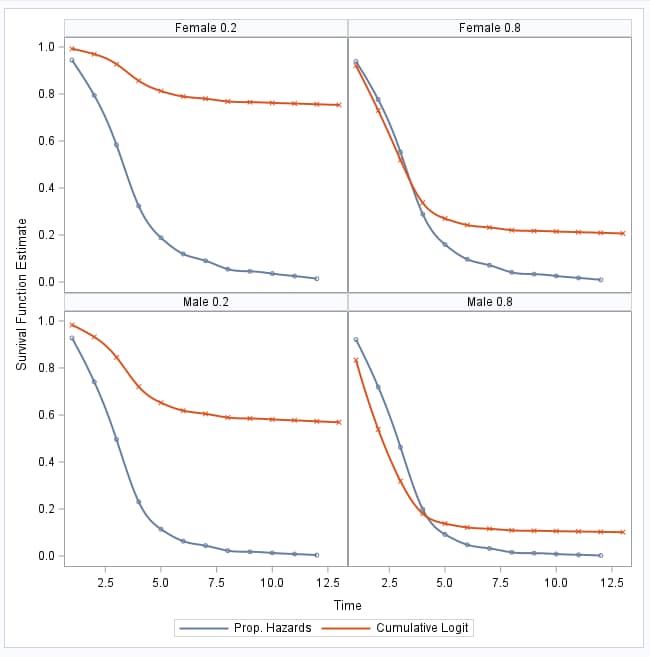
But the models cannot be expected to be similar for censored data since, as noted above, the cumulative logistic model does not account for censoring. Suppose the cumulative logistic model is fit to data that includes the TIME=14 observations, treating those beetles as all dying on day 14. The following plot compares the survival curves from that model to those from the proportional hazards model that accounts for the censoring. Notice that the survival curves from the cumulative logistic model deviate markedly from those from the proportional hazards model:
 |
Operating System and Release Information
| Product Family | Product | System | SAS Release | |
| Reported | Fixed* | |||
| SAS System | SAS/STAT | z/OS | ||
| z/OS 64-bit | ||||
| OpenVMS VAX | ||||
| Microsoft® Windows® for 64-Bit Itanium-based Systems | ||||
| Microsoft Windows Server 2003 Datacenter 64-bit Edition | ||||
| Microsoft Windows Server 2003 Enterprise 64-bit Edition | ||||
| Microsoft Windows XP 64-bit Edition | ||||
| Microsoft® Windows® for x64 | ||||
| OS/2 | ||||
| Microsoft Windows 8 Enterprise 32-bit | ||||
| Microsoft Windows 8 Enterprise x64 | ||||
| Microsoft Windows 8 Pro 32-bit | ||||
| Microsoft Windows 8 Pro x64 | ||||
| Microsoft Windows 8.1 Enterprise 32-bit | ||||
| Microsoft Windows 8.1 Enterprise x64 | ||||
| Microsoft Windows 8.1 Pro 32-bit | ||||
| Microsoft Windows 8.1 Pro x64 | ||||
| Microsoft Windows 10 | ||||
| Microsoft Windows 11 | ||||
| Microsoft Windows 95/98 | ||||
| Microsoft Windows 2000 Advanced Server | ||||
| Microsoft Windows 2000 Datacenter Server | ||||
| Microsoft Windows 2000 Server | ||||
| Microsoft Windows 2000 Professional | ||||
| Microsoft Windows NT Workstation | ||||
| Microsoft Windows Server 2003 Datacenter Edition | ||||
| Microsoft Windows Server 2003 Enterprise Edition | ||||
| Microsoft Windows Server 2003 Standard Edition | ||||
| Microsoft Windows Server 2003 for x64 | ||||
| Microsoft Windows Server 2008 | ||||
| Microsoft Windows Server 2008 R2 | ||||
| Microsoft Windows Server 2008 for x64 | ||||
| Microsoft Windows Server 2012 Datacenter | ||||
| Microsoft Windows Server 2012 R2 Datacenter | ||||
| Microsoft Windows Server 2012 R2 Std | ||||
| Microsoft Windows Server 2012 Std | ||||
| Microsoft Windows Server 2016 | ||||
| Microsoft Windows Server 2019 | ||||
| Microsoft Windows Server 2022 | ||||
| Microsoft Windows XP Professional | ||||
| Windows 7 Enterprise 32 bit | ||||
| Windows 7 Enterprise x64 | ||||
| Windows 7 Home Premium 32 bit | ||||
| Windows 7 Home Premium x64 | ||||
| Windows 7 Professional 32 bit | ||||
| Windows 7 Professional x64 | ||||
| Windows 7 Ultimate 32 bit | ||||
| Windows 7 Ultimate x64 | ||||
| Windows Millennium Edition (Me) | ||||
| Windows Vista | ||||
| Windows Vista for x64 | ||||
| 64-bit Enabled AIX | ||||
| 64-bit Enabled HP-UX | ||||
| 64-bit Enabled Solaris | ||||
| ABI+ for Intel Architecture | ||||
| AIX | ||||
| HP-UX | ||||
| HP-UX IPF | ||||
| IRIX | ||||
| Linux | ||||
| Linux for x64 | ||||
| Linux on Itanium | ||||
| OpenVMS Alpha | ||||
| OpenVMS on HP Integrity | ||||
| Solaris | ||||
| Solaris for x64 | ||||
| Tru64 UNIX | ||||
| Type: | Usage Note |
| Priority: | |
| Topic: | Analytics ==> Categorical Data Analysis Analytics ==> Survival Analysis SAS Reference ==> Procedures ==> ICPHREG SAS Reference ==> Procedures ==> LOGISTIC |
| Date Modified: | 2023-04-07 15:05:25 |
| Date Created: | 2023-04-05 15:46:36 |