Sample 57766: Add multiple tables and graphs to each worksheet using the ODS Destination for Excel
 |  |  |  |  |
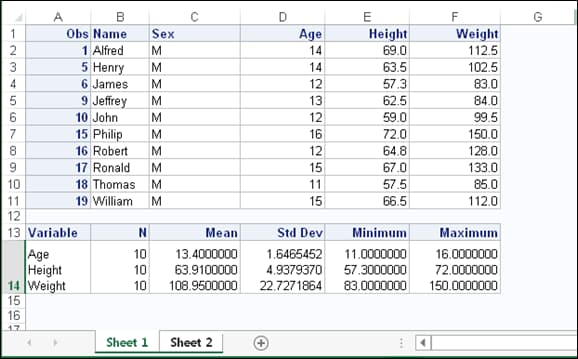
You can add multiple tables or graphs to each worksheet with the ODS Destination for Excel beginning with the fifth maintenance release of SAS® 9.4 (TS1M5). This can be accomplished by specifying the SHEET_INTERVAL="NOW" option.
If you are using a release of SAS prior to SAS 9.4 (TS1M5), you can use the use the SHEET_INTERVAL="OUTPUT" option along with adding a dummy procedure or DATA step. The dummy procedure or DATA step creates an output object that can then be excluded from the worksheet using the ODS EXCLUDE statement.
Click the Full Code tab to see example code that generates two tables on each worksheet.
The pre-production version of the ODS Destination for Excel generated a new worksheet whenever the SHEET_NAME= option was encountered. This is not the same behavior for the production release.
These sample files and code examples are provided by SAS Institute Inc. "as is" without warranty of any kind, either express or implied, including but not limited to the implied warranties of merchantability and fitness for a particular purpose. Recipients acknowledge and agree that SAS Institute shall not be liable for any damages whatsoever arising out of their use of this material. In addition, SAS Institute will provide no support for the materials contained herein.
/* Ex1. */


ods excel file="c:\test\test\temp.xlsx" options(sheet_interval="none");

proc print data=sashelp.class(where=(sex="M"));
run;

proc means data=sashelp.class(where=(sex="M"));
run;


ods excel options(sheet_interval="now");

proc print data=sashelp.class(where=(sex="F"));
run;

proc means data=sashelp.class(where=(sex="F"));
run;

ods excel close;


/* Ex2. */


ods excel file="c:\temp.xlsx" options(sheet_interval="none");

proc print data=sashelp.class(where=(sex="M"));
run;

proc means data=sashelp.class(where=(sex="M"));
run;

/* Create a dummy worksheet using the DATA _NULL_ step */

ods excel options(sheet_interval="output");

ods exclude all;
data _null_;
   declare odsout obj();
run;
ods select all;

ods excel options(sheet_interval="none");
proc print data=sashelp.class(where=(sex="F"));
run;

proc means data=sashelp.class(where=(sex="F"));
run;

ods excel close;
These sample files and code examples are provided by SAS Institute Inc. "as is" without warranty of any kind, either express or implied, including but not limited to the implied warranties of merchantability and fitness for a particular purpose. Recipients acknowledge and agree that SAS Institute shall not be liable for any damages whatsoever arising out of their use of this material. In addition, SAS Institute will provide no support for the materials contained herein.
| Type: | Sample |
| Date Modified: | 2019-06-13 16:02:52 |
| Date Created: | 2016-03-01 07:47:59 |
Operating System and Release Information
| Product Family | Product | Host | Product Release | SAS Release | ||
| Starting | Ending | Starting | Ending | |||
| SAS System | Base SAS | Microsoft Windows Server 2012 Datacenter | 9.4_M5 | 9.4 TS1M5 | ||
| Microsoft Windows Server 2012 R2 Std | 9.4_M5 | 9.4 TS1M5 | ||||
| Microsoft Windows Server 2012 R2 Datacenter | 9.4_M5 | 9.4 TS1M5 | ||||
| HP-UX IPF | 9.4_M5 | 9.4 TS1M5 | ||||
| Solaris for x64 | 9.4_M5 | 9.4 TS1M5 | ||||
| Linux for x64 | 9.4_M5 | 9.4 TS1M5 | ||||
| 64-bit Enabled Solaris | 9.4_M5 | 9.4 TS1M5 | ||||
| 64-bit Enabled AIX | 9.4_M5 | 9.4 TS1M5 | ||||
| Windows 7 Ultimate 32 bit | 9.4_M5 | 9.4 TS1M5 | ||||
| Windows 7 Ultimate x64 | 9.4_M5 | 9.4 TS1M5 | ||||
| Windows 7 Professional 32 bit | 9.4_M5 | 9.4 TS1M5 | ||||
| Windows 7 Home Premium x64 | 9.4_M5 | 9.4 TS1M5 | ||||
| Windows 7 Enterprise 32 bit | 9.4_M5 | 9.4 TS1M5 | ||||
| Windows 7 Home Premium 32 bit | 9.4_M5 | 9.4 TS1M5 | ||||
| Windows 7 Professional x64 | 9.4_M5 | 9.4 TS1M5 | ||||
| Windows 7 Enterprise x64 | 9.4_M5 | 9.4 TS1M5 | ||||
| Microsoft Windows Server 2016 | 9.4_M5 | 9.4 TS1M5 | ||||
| Microsoft Windows Server 2012 Std | 9.4_M5 | 9.4 TS1M5 | ||||
| Microsoft Windows Server 2008 for x64 | 9.4_M5 | 9.4 TS1M5 | ||||
| Microsoft Windows Server 2008 R2 | 9.4_M5 | 9.4 TS1M5 | ||||
| Microsoft Windows Server 2008 | 9.4_M5 | 9.4 TS1M5 | ||||
| Microsoft Windows 10 | 9.4_M5 | 9.4 TS1M5 | ||||
| Microsoft Windows 8.1 Pro x64 | 9.4_M5 | 9.4 TS1M5 | ||||
| Microsoft Windows 8.1 Pro 32-bit | 9.4_M5 | 9.4 TS1M5 | ||||
| Microsoft Windows 8.1 Enterprise x64 | 9.4_M5 | 9.4 TS1M5 | ||||
| Microsoft Windows 8.1 Enterprise 32-bit | 9.4_M5 | 9.4 TS1M5 | ||||
| Microsoft Windows 8 Pro x64 | 9.4_M5 | 9.4 TS1M5 | ||||
| Microsoft Windows 8 Pro 32-bit | 9.4_M5 | 9.4 TS1M5 | ||||
| Microsoft Windows 8 Enterprise x64 | 9.4_M5 | 9.4 TS1M5 | ||||
| Microsoft Windows 8 Enterprise 32-bit | 9.4_M5 | 9.4 TS1M5 | ||||
| Microsoft® Windows® for x64 | 9.4_M5 | 9.4 TS1M5 | ||||
| z/OS 64-bit | 9.4_M5 | 9.4 TS1M5 | ||||
| z/OS | 9.4_M5 | 9.4 TS1M5 | ||||