Sample 49696: Generate side-by-side graphs with Y and Y2 axes with the Graph Template Language (GTL)
The sample code on the
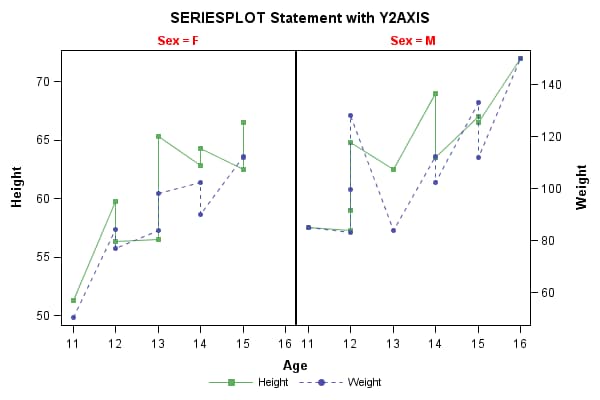
Full Code tab uses the Graph Template Language (GTL) to generate side-by-side panels with Y and Y2 axes. The YAXIS=Y2 option is specified in the second SERIESPLOT statement, producing the right vertical axis. In this example, the HEADERLABELATTRS= option in the LAYOUT DATAPANEL statement specifies the style attributes to be used for the header labels.
You can also remove the legend and header borders. This is done by defining a style template with GRAPHBORDERLINES and GRAPHBACKGROUND set to white, and specifying HEADEROPAQUE=FALSE in the LAYOUT DATAPANEL statement. The STYLE= option in the ODS HTML statement points to the newly defined style template.
These sample files and code examples are provided by SAS Institute
Inc. "as is" without warranty of any kind, either express or implied, including
but not limited to the implied warranties of merchantability and fitness for a
particular purpose. Recipients acknowledge and agree that SAS Institute shall
not be liable for any damages whatsoever arising out of their use of this material.
In addition, SAS Institute will provide no support for the materials contained herein.
The following example uses GTL to generate side-by-side panels with Y and Y2 axes. The YAXIS=Y2 option is specified in the second SERIESPLOT statement, producing the right vertical axis. In this example, the HEADERLABELATTRS= option in the LAYOUT DATAPANEL statement specifies the style attributes to be used for the header labels.
You can also remove the legend and header borders. That is done by defining a style template with GRAPHBORDERLINES and GRAPHBACKGROUND set to white, and specifying HEADEROPAQUE=FALSE in the LAYOUT DATAPANEL statement. The STYLE= option in the ODS HTML statement points to the newly defined style template.
proc template;
   define statgraph plot;
   begingraph;
      entrytitle "SERIESPLOT Statement with Y2AXIS" ;
      layout datapanel classvars=(sex) / columns=2 rows=1
                                         headerlabelattrs=(color=red weight=bold) headeropaque=false;
         layout prototype;
            seriesplot x=age y=height / display=all name='height'
                                        lineattrs=(color=cx5DAF5D)
                                        markerattrs=(symbol=squarefilled color=cx5DAF5D);
            seriesplot x=age y=weight / yaxis=y2 display=all name='weight'
                                        lineattrs=(color=cx4B50AA pattern=2)
                                        markerattrs=(symbol=circlefilled color=cx4B50AA);
         endlayout;
         sidebar / align=bottom;
            discretelegend 'height' 'weight' / ;
         endsidebar;
      endlayout;
   endgraph;
   end;

   define style noheaderborder;
      parent = styles.default;
         class graphborderlines / contrastcolor=white;
         class graphbackground / color=white ;
   end;
run;

proc sort data=sashelp.class out=class;
   by age;
run;

ods html style=noheaderborder;

proc sgrender data=class template=plot;
run;
These sample files and code examples are provided by SAS Institute
Inc. "as is" without warranty of any kind, either express or implied, including
but not limited to the implied warranties of merchantability and fitness for a
particular purpose. Recipients acknowledge and agree that SAS Institute shall
not be liable for any damages whatsoever arising out of their use of this material.
In addition, SAS Institute will provide no support for the materials contained herein.
This sample illustrates how to generate side-by-side graphs with Y and Y2 axes with the Graph Template Language (GTL).
| Type: | Sample |
| Topic: | SAS Reference ==> Procedures ==> SGRENDER
|
| Date Modified: | 2021-08-04 16:51:11 |
| Date Created: | 2013-04-19 12:14:14 |
Operating System and Release Information
| SAS System | SAS/GRAPH | z/OS | 9.2 TS1M0 | |
| Microsoft® Windows® for 64-Bit Itanium-based Systems | 9.2 TS1M0 | |
| Microsoft Windows Server 2003 Datacenter 64-bit Edition | 9.2 TS1M0 | |
| Microsoft Windows Server 2003 Enterprise 64-bit Edition | 9.2 TS1M0 | |
| Microsoft Windows XP 64-bit Edition | 9.2 TS1M0 | |
| Microsoft® Windows® for x64 | 9.2 TS1M0 | |
| Microsoft Windows Server 2003 Datacenter Edition | 9.2 TS1M0 | |
| Microsoft Windows Server 2003 Enterprise Edition | 9.2 TS1M0 | |
| Microsoft Windows Server 2003 Standard Edition | 9.2 TS1M0 | |
| Microsoft Windows XP Professional | 9.2 TS1M0 | |
| Windows Vista | 9.2 TS1M0 | |
| Windows Vista for x64 | 9.2 TS1M0 | |
| 64-bit Enabled AIX | 9.2 TS1M0 | |
| 64-bit Enabled HP-UX | 9.2 TS1M0 | |
| 64-bit Enabled Solaris | 9.2 TS1M0 | |
| HP-UX IPF | 9.2 TS1M0 | |
| Linux | 9.2 TS1M0 | |
| Linux for x64 | 9.2 TS1M0 | |
| OpenVMS on HP Integrity | 9.2 TS1M0 | |
| Solaris for x64 | 9.2 TS1M0 | |


