Sample 48333: Create a broken axis panel graph using the GCHART and GREPLAY procedures
 |  |  |  |  |
This sample uses the GCHART procedure together with the GREPLAY procedure to create a broken axis panel graph. The data for the vertical axis variable used in this sample ranges from 0 to 220. However, the graph that this sample code creates is a two-panel graph, where the vertical axis range for the lower graph ranges from 0 to 25 and the vertical axis range for the upper graph ranges from 205 to 220.
The sample code on the Full Code tab first uses DATA step code to separate the original data set into two unique data sets. Two GCHART procedure steps are then used to create the two individual graphs. In a final step, the GREPLAY procedure is used to stack the two graphs on top of each other.
These sample files and code examples are provided by SAS Institute Inc. "as is" without warranty of any kind, either express or implied, including but not limited to the implied warranties of merchantability and fitness for a particular purpose. Recipients acknowledge and agree that SAS Institute shall not be liable for any damages whatsoever arising out of their use of this material. In addition, SAS Institute will provide no support for the materials contained herein.
Note that this sample code is very data dependent. You will have to make significant changes to the sample code to get it to work with your data. Also, a certain amount of trial and error will be necessary in order for the final GREPLAY graph to line up properly.
 /* This step deletes any existing graphs in the WORK.GSEG graphics catalog */
%macro delcat(catname);
   %if %sysfunc(cexist(&catname)) %then %do;
      proc greplay nofs igout=&catname;
         delete _all_;
      run;
      quit;
   %end;
%mend delcat;

%delcat(work.gseg);

data test1;
   input xvar $ yvar;
   datalines;
A   10
B   15
C   12
D   18
E   215
F   220
;
run;

 /* Use DATA step code to split the original */
 /* data into to separate data sets.         */
data test2;
   set test1;
   if yvar > 25 then yvar=25;
run;

data test3;
   set test1;
   if yvar <= 25 then yvar=0;
run;

 /* Set the graphics environment */
goptions reset=all device=png cback=white border
         htitle=12pt htitle=12pt htext=10pt ftext='Albany AMT'
         xpixels=600 ypixels=400 nodisplay;

ods _all_ close;
ods listing;

 /* Use two PROC GCHART steps to create the lower */
 /* and upper graphs.                             */
axis1 order=(0 to 25 by 5) minor=none
      length=41pct label=none origin=(30pct,15pct)
      offset=(0,0);
axis2 label=none;

proc gchart data=test2;
   vbar xvar / sumvar=yvar raxis=axis1 maxis=axis2
               width=9 space=3;
run;
quit;

axis1 order=(205 to 220 by 5) minor=none
      length=25pct label=none origin=(30pct,60pct);
axis2 label=none minor=none major=none value=none;

title1 h=1 '  ';
title2 h=13pt f="Albany AMT/bold" 'Broken Axis Panel Graph';

proc gchart data=test3;
   vbar xvar / sumvar=yvar raxis=axis1 maxis=axis2
               width=9 space=3;
run;
quit;

filename grafout 'broken_axis.png';

goptions reset=all device=png gsfname=grafout gsfmode=replace
         xpixels=600 ypixels=400 border;

 /* Use PROC GREPLAY to combine the two graphs, stacking  */
 /* the second graph on top of the first graph.           */
proc greplay igout=work.gseg nofs tc=sashelp.templt
             template=whole;
   treplay 1:1 1:2;
run;
quit;
These sample files and code examples are provided by SAS Institute Inc. "as is" without warranty of any kind, either express or implied, including but not limited to the implied warranties of merchantability and fitness for a particular purpose. Recipients acknowledge and agree that SAS Institute shall not be liable for any damages whatsoever arising out of their use of this material. In addition, SAS Institute will provide no support for the materials contained herein.
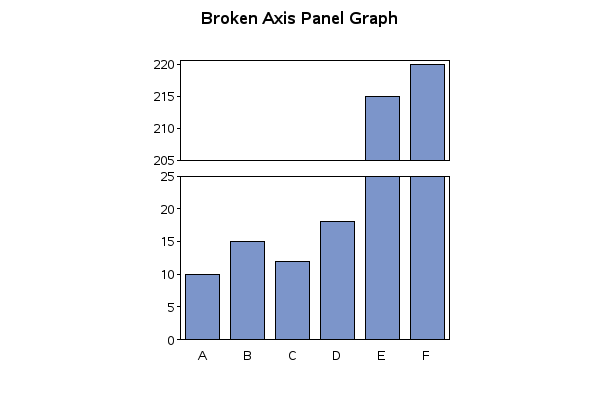
This sample illustrates how to create a broken axis panel graph using the GCHART and GREPLAY procedures.
| Type: | Sample |
| Topic: | SAS Reference ==> Procedures ==> GCHART Query and Reporting ==> Creating Reports ==> Graphical ==> Graph Types ==> Charts ==> Bar |
| Date Modified: | 2012-11-12 10:13:55 |
| Date Created: | 2012-10-31 09:42:57 |
Operating System and Release Information
| Product Family | Product | Host | SAS Release | |
| Starting | Ending | |||
| SAS System | SAS/GRAPH | z/OS | 9.1 TS1M0 | |
| Microsoft® Windows® for 64-Bit Itanium-based Systems | 9.1 TS1M0 | |||
| Microsoft Windows Server 2003 Datacenter 64-bit Edition | 9.1 TS1M0 | |||
| Microsoft Windows Server 2003 Enterprise 64-bit Edition | 9.1 TS1M0 | |||
| Microsoft Windows 2000 Advanced Server | 9.1 TS1M0 | |||
| Microsoft Windows 2000 Datacenter Server | 9.1 TS1M0 | |||
| Microsoft Windows 2000 Server | 9.1 TS1M0 | |||
| Microsoft Windows 2000 Professional | 9.1 TS1M0 | |||
| Microsoft Windows NT Workstation | 9.1 TS1M0 | |||
| Microsoft Windows Server 2003 Datacenter Edition | 9.1 TS1M0 | |||
| Microsoft Windows Server 2003 Enterprise Edition | 9.1 TS1M0 | |||
| Microsoft Windows Server 2003 Standard Edition | 9.1 TS1M0 | |||
| Microsoft Windows XP Professional | 9.1 TS1M0 | |||
| 64-bit Enabled AIX | 9.1 TS1M0 | |||
| 64-bit Enabled HP-UX | 9.1 TS1M0 | |||
| 64-bit Enabled Solaris | 9.1 TS1M0 | |||
| HP-UX IPF | 9.1 TS1M0 | |||
| Linux | 9.1 TS1M0 | |||
| OpenVMS Alpha | 9.1 TS1M0 | |||
| Tru64 UNIX | 9.1 TS1M0 | |||