Usage Note 47246: Generating a Q-Q plot with PROC SGPLOT
 |  |  |
PROC SGPLOT does not have a QQPLOT statement like the one available in PROC UNIVARIATE, but you can use the SCATTER statement to create normal quantile-quantile plots after first computing the normal quantiles of your data.
The example titled "Creating a Normal Quantile Plot" in the Examples section of the UNIVARIATE documentation includes the following data set. An engineer is analyzing the distribution of distances between holes cut in steel sheets. The following statements save measurements of the distance between two holes cut into 50 steel sheets as values of the variable Distance in the data set Sheets:
input Distance @@;
label Distance = 'Hole Distance (cm)';
datalines;
9.80 10.20 10.27 9.70 9.76 10.11 10.24 10.20
10.24 9.63 9.99 9.78 10.10 10.21 10.00 9.96
9.79 10.08 9.79 10.06 10.10 9.95 9.84 10.11
9.93 10.56 10.47 9.42 10.44 10.16 10.11 10.36
9.94 9.77 9.36 9.89 9.62 10.05 9.72 9.82 9.99
10.16 10.58 10.70 9.54 10.31 10.07 10.33 9.98 10.15
;
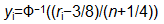
A normal quantile plot is a plot of the ordered data values against their normal quantiles. Normal quantiles are computed as recommended by Blom (1958):
The Blom scores for the Distance variable can be computed and saved using the NORMAL=BLOM option in PROC RANK:
var Distance;
ranks Dist_Quant;
run;
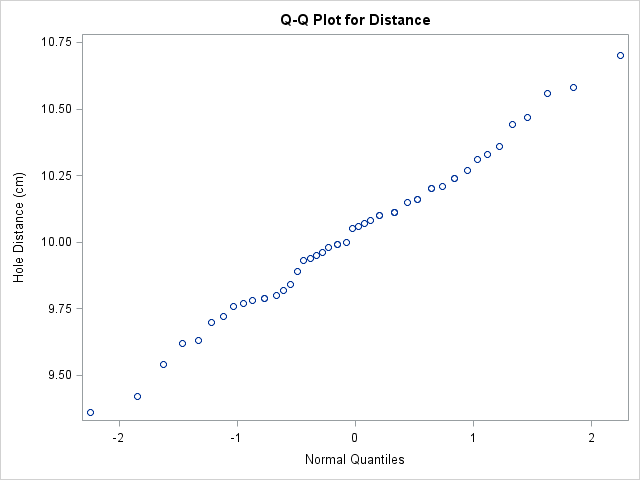
The SCATTER statement in PROC SGPLOT produces a Q-Q plot for Distance using the original data values and their normal quantiles:
proc sgplot data=SheetsQuant;
scatter x=Dist_Quant y=Distance;
xaxis label="Normal Quantiles";
run;
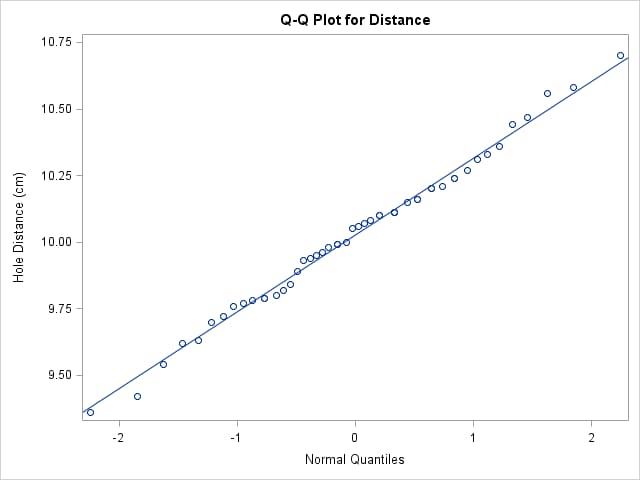
You can use the LINEPARM statement to add a straight reference line whose slope and intercept are the scale and location parameters of the theoretical distribution. First, compute and save the parameters in an output data set using PROC UNIVARIATE.
var Distance;
output out=Parameters mean=mean std=std;
run;
This PROC SQL step reads the parameter values and stores them in macro variables named Loc and Scale.
select Mean, Std
into :Loc, :Scale
from Parameters;
quit;
The following statements produce the Q-Q plot with an added reference line.
scatter x=Dist_Quant y=Distance;
lineparm x=0 y=&loc slope=&scale;
run;
Note that if there are ties in the data, then the PROC RANK normal scores also contain ties. To match the Q-Q plot in PROC UNIVARIATE exactly, you can use a DATA step to compute the normal scores from the order statistics.
First, store the number of nonmissing values in a macro variable:
var Distance;
output out=out n=n;
run;
data _null_;
set out;
call symput('nobs',n);
run;
The following steps compute the Blom scores using the order statistics:
by Distance;
run;
data sheets;
set sheets;
if Distance ne . ;
n+1;
Dist_Quant=probit( (n-0.375) / (&nobs+0.25) );
run;
The same PROC SGPLOT code from above can be used to generate the Q-Q plot.
Reference:
Blom, G. (1958), Statistical Estimates and Transformed Beta Variables, New York: John Wiley & Sons.
Operating System and Release Information
| Product Family | Product | System | SAS Release | |
| Reported | Fixed* | |||
| SAS System | SAS/GRAPH | z/OS | 9.2 TS1M0 | |
| Microsoft® Windows® for 64-Bit Itanium-based Systems | 9.2 TS1M0 | |||
| Microsoft Windows Server 2003 Datacenter 64-bit Edition | 9.2 TS1M0 | |||
| Microsoft Windows Server 2003 Enterprise 64-bit Edition | 9.2 TS1M0 | |||
| Microsoft Windows XP 64-bit Edition | 9.2 TS1M0 | |||
| Microsoft® Windows® for x64 | 9.2 TS1M0 | |||
| Microsoft Windows Server 2003 Datacenter Edition | 9.2 TS1M0 | |||
| Microsoft Windows Server 2003 Enterprise Edition | 9.2 TS1M0 | |||
| Microsoft Windows Server 2003 Standard Edition | 9.2 TS1M0 | |||
| Microsoft Windows XP Professional | 9.2 TS1M0 | |||
| Windows Vista | 9.2 TS1M0 | |||
| Windows Vista for x64 | 9.2 TS1M0 | |||
| 64-bit Enabled AIX | 9.2 TS1M0 | |||
| 64-bit Enabled HP-UX | 9.2 TS1M0 | |||
| 64-bit Enabled Solaris | 9.2 TS1M0 | |||
| HP-UX IPF | 9.2 TS1M0 | |||
| Linux | 9.2 TS1M0 | |||
| Linux for x64 | 9.2 TS1M0 | |||
| OpenVMS on HP Integrity | 9.2 TS1M0 | |||
| Solaris for x64 | 9.2 TS1M0 | |||