Sample 43855: Forest plot macro
 |  |  |  |  |  |
This sample creates several forest plots using the Graph Template Language (GTL). This sample is supported beginning with the third maintenance release of SAS 9.2 (TS2M3).
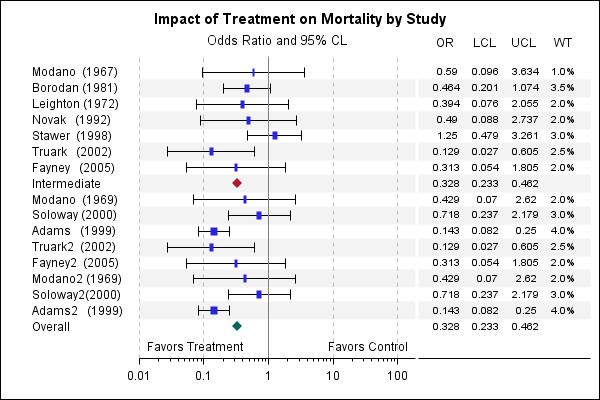
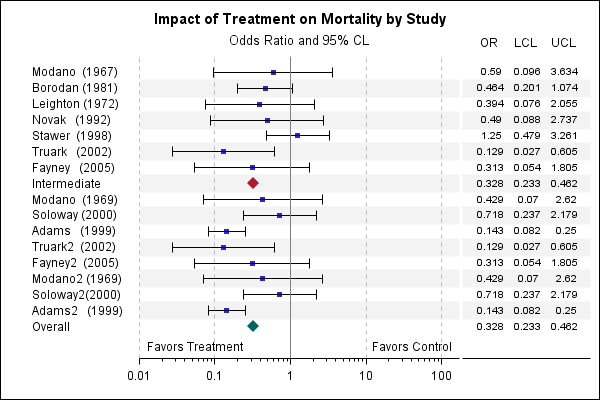
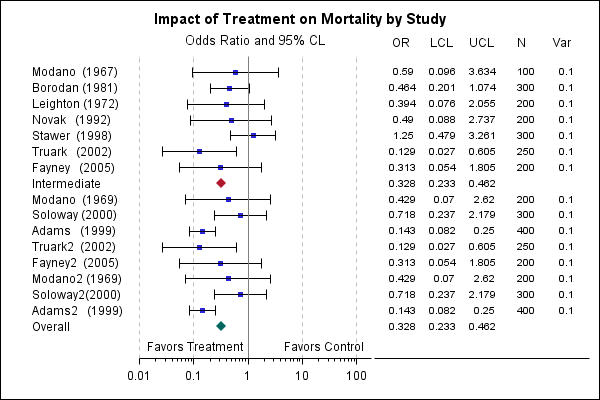
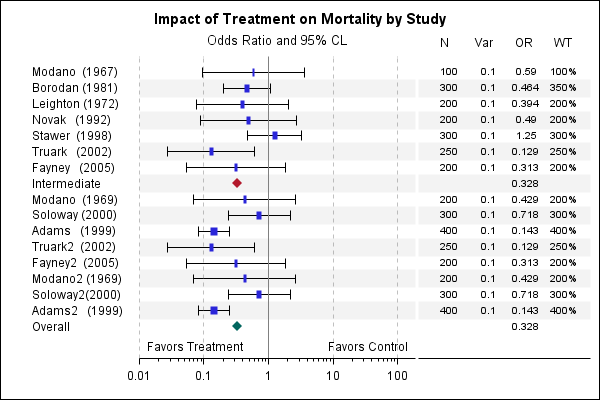
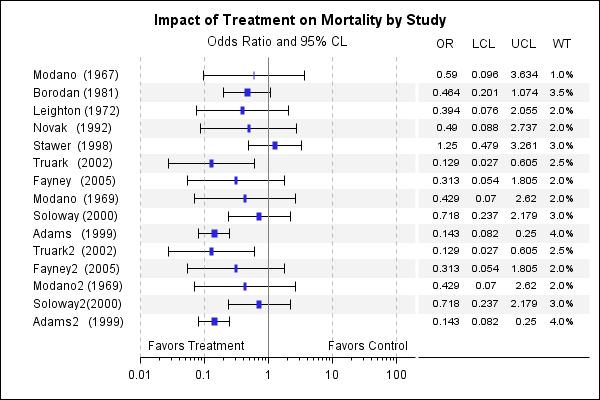
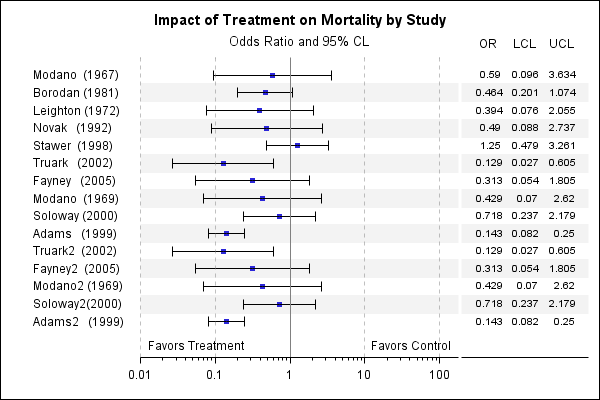
A forest plot is a graphical display of the relative strength of treatment effects in multiple quantitative scientific studies addressing the same question (Wikipedia). This sample creates several forest plots.
The sample requires a macro that can be downloaded from the Downloads tab. After downloading the macro, the sample code on the Full Code tab can be submitted from your SAS session.
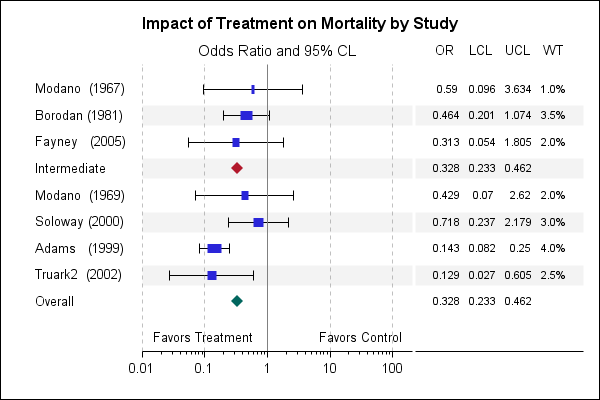
Three types of observations (1-Study, 2-Subgroup, and 3-Overall) are supported using the optional GROUP variable. These are rendered using the GraphData1, GraphData2, and GraphData3 style elements, respectively.
Two macro variables, MYPATH and MACROLOC, are created at the beginning of the sample code. MYPATH contains the path to the directory in which the graphs and the HTML file are stored. This macro variable is currently set to C:\TEMP. The macro variable MACROLOC contains the path to the directory in which the SAS program ForestMacro.sas is stored. This program needs to be downloaded from the Downloads tab. In the sample code, the SAS program ForestMacro.sas is expected to be stored in the C:\TEMP folder.
The macro parameters are described below.
| Macro Parameter | Description with default value |
|---|---|
| Data= | Data set name (required) |
| Study= | Variable name for study (required) |
| OddsRatio= | Variable name for odds ratio (required) |
| LCL= | Variable name for lower confidence limit (required) |
| UCL= | Variable name for upper confidence limit (required) |
| Group= | Variable name for study type |
| Weight= | Variable name for study weight in % |
| StatCol1= | Variable name for an additional stat column to be displayed |
| StatCol2= | Variable name for an additional stat column to be displayed |
| StatCol3= | Variable name for an additional stat column to be displayed |
| StatCol4= | Variable name for an additional stat column to be displayed |
| DisplayCols=YES | Display the columns for OR, LCL, UCL, and Weight |
| WfFactor= | Multiplier factor for study weights |
| Bands=YES | Draw horizontal alternating bands |
| Borders=NO | Draw borders |
| GraphWalls=NO | Draw filled walls behind the graph |
| StatWalls=NO | Draw filled walls behind the statistics tables |
| Width=640px | Width of the graph |
| Height= | Height of the graph, which is estimated if not provided |
| LabelColWidth= | Fractional width for label column (default=0.2) |
| Label1= | Favorable label (default="Favors Treatment") |
| Label2= | Unfavorable label (default="Favors Control") |
| PlotTitle= | Plot title (default="Odds Ratio and 95% CL") |
| FootNote= | Graph footnote |
| Title2= | Graph subtitle |
| Title= | Graph title (default="Impact of Treatment on Mortality by Study”) |
These sample files and code examples are provided by SAS Institute Inc. "as is" without warranty of any kind, either express or implied, including but not limited to the implied warranties of merchantability and fitness for a particular purpose. Recipients acknowledge and agree that SAS Institute shall not be liable for any damages whatsoever arising out of their use of this material. In addition, SAS Institute will provide no support for the materials contained herein.
Two macro variables, MYPATH and MACROLOC, are created at the beginning of the sample code. MYPATH contains the path to the directory in which the graphs and the HTML file are stored. This macro variable is currently set to C:\TEMP. The macro variable MACROLOC contains the path to the directory in which the SAS program ForestMacro.sas is stored. This program needs to be downloaded from the Downloads tab. In the sample code below, the SAS program ForestMacro.sas is expected to be stored in the C:\TEMP folder.
%let mygpath=C:\temp;
%let macroLoc=C:\temp;
/*--Set up data set--*/
data forest;
input StudyName $1-16 GroupId or lcl ucl wt N Var ZeroWt;
label or='OR' lcl='LCL' ucl='UCL' wt='WT';
format wt percent6.1;
datalines;
Modano (1967) 1 0.590 0.096 3.634 1 100 0.1 .
Borodan (1981) 1 0.464 0.201 1.074 3.5 300 0.1 0
Leighton (1972) 1 0.394 0.076 2.055 2 200 0.1 0
Novak (1992) 1 0.490 0.088 2.737 2 200 0.1 .
Stawer (1998) 1 1.250 0.479 3.261 3 300 0.1 .
Truark (2002) 1 0.129 0.027 0.605 2.5 250 0.1 .
Fayney (2005) 1 0.313 0.054 1.805 2 200 0.1 .
Intermediate 2 0.328 0.233 0.462 . . . .
Modano (1969) 1 0.429 0.070 2.620 2 200 0.1 .
Soloway (2000) 1 0.718 0.237 2.179 3 300 0.1 .
Adams (1999) 1 0.143 0.082 0.250 4 400 0.1 .
Truark2 (2002) 1 0.129 0.027 0.605 2.5 250 0.1 .
Fayney2 (2005) 1 0.313 0.054 1.805 2 200 0.1 .
Modano2 (1969) 1 0.429 0.070 2.620 2 200 0.1 .
Soloway2(2000) 1 0.718 0.237 2.179 3 300 0.1 .
Adams2 (1999) 1 0.143 0.082 0.250 4 400 0.1 .
Overall 3 0.328 0.233 0.462 . . . .
;
run;
options sasautos=("¯oLoc", sasautos);
options mautosource mprint mlogic;
ods listing close;
ods html image_dpi=100 style=listing path="&mygpath" file='forestplots.html';
ods graphics / reset width=600px height=400px;
/*--Forest Plot with common options--*/
%ForestMacro(data=forest, Study=StudyName, Group=GroupId, OddsRatio=or, LCL=lcl, UCL=ucl,
width=6.5in, Weight=wt, Bands=YES, GraphWalls=YES, DisplayCols=yes);
/*--Forest Plot with minimum options--*/
%ForestMacro(data=forest, Study=StudyName, Group=GroupId, OddsRatio=or, LCL=lcl, UCL=ucl);
/*--Forest Plot with additional statistics columns--*/
%ForestMacro(data=forest, Study=StudyName, Group=GroupId, OddsRatio=OR, LCL=lcl, UCL=ucl,
StatCol1=N, StatCol2=Var, Bands=NO, GraphWalls=NO, StatWalls=NO, Borders=NO);
/*--Forest Plot with ONLY additional statistics columns--*/
%ForestMacro(data=forest, Study=StudyName, Group=GroupId, OddsRatio=OR, LCL=lcl, UCL=ucl,
Weight=wt, DisplayCols=N, StatCol1=N, StatCol2=Var, StatCol3=OR, StatCol4=wt, GraphWalls=Yep, Borders=);
data ForestNoGroups;
set Forest (where=(GroupId=1));
drop GroupId;
run;
/*--Forest Plot with no statistics columns--*/
%ForestMacro(data=ForestNoGroups, Study=StudyName, OddsRatio=OR, LCL=lcl, UCL=ucl,
DisplayCols=YES, Weight=wt, GraphWalls=YES, StatWalls=yes, Borders=NO);
/*--Forest Plot with no statistics columns--*/
%ForestMacro(data=ForestNoGroups, Study=StudyName, OddsRatio=OR, LCL=lcl, UCL=ucl,
DisplayCols=YES, GraphWalls=YES, StatWalls=yes, Borders=NO);
/*--Set up data set--*/
data forest2;
input StudyName $1-16 GroupId or lcl ucl wt N Var ZeroWt;
label or='OR' lcl='LCL' ucl='UCL' wt='WT';
format wt percent6.1;
datalines;
Modano (1967) 1 0.590 0.096 3.634 1 100 0.1 .
Borodan (1981) 1 0.464 0.201 1.074 3.5 300 0.1 0
Fayney (2005) 1 0.313 0.054 1.805 2 200 0.1 .
Intermediate 2 0.328 0.233 0.462 . . . .
Modano (1969) 1 0.429 0.070 2.620 2 200 0.1 .
Soloway (2000) 1 0.718 0.237 2.179 3 300 0.1 .
Adams (1999) 1 0.143 0.082 0.250 4 400 0.1 .
Truark2 (2002) 1 0.129 0.027 0.605 2.5 250 0.1 .
Overall 3 0.328 0.233 0.462 . . . .
;
run;
/*--Forest Plot with common options--*/
%ForestMacro(data=forest2, Study=StudyName, Group=GroupId, OddsRatio=or, LCL=lcl, UCL=ucl,
Weight=wt, Bands=YES, GraphWalls=YES, DisplayCols=YES);
ods html close;
ods listing;
These sample files and code examples are provided by SAS Institute Inc. "as is" without warranty of any kind, either express or implied, including but not limited to the implied warranties of merchantability and fitness for a particular purpose. Recipients acknowledge and agree that SAS Institute shall not be liable for any damages whatsoever arising out of their use of this material. In addition, SAS Institute will provide no support for the materials contained herein.
| Type: | Sample |
| Topic: | Query and Reporting ==> Creating Reports ==> Graphical ==> Clinical Macros |
| Date Modified: | 2011-08-11 11:24:32 |
| Date Created: | 2011-07-28 12:38:30 |
Operating System and Release Information
| Product Family | Product | Host | SAS Release | |
| Starting | Ending | |||
| SAS System | SAS/GRAPH | z/OS | 9.2 TS2M3 | |
| Microsoft® Windows® for 64-Bit Itanium-based Systems | 9.2 TS2M3 | |||
| Microsoft Windows Server 2003 Datacenter 64-bit Edition | 9.2 TS2M3 | |||
| Microsoft Windows Server 2003 Enterprise 64-bit Edition | 9.2 TS2M3 | |||
| Microsoft Windows XP 64-bit Edition | 9.2 TS2M3 | |||
| Microsoft® Windows® for x64 | 9.2 TS2M3 | |||
| Microsoft Windows Server 2003 Datacenter Edition | 9.2 TS2M3 | |||
| Microsoft Windows Server 2003 Enterprise Edition | 9.2 TS2M3 | |||
| Microsoft Windows Server 2003 Standard Edition | 9.2 TS2M3 | |||
| Microsoft Windows Server 2003 for x64 | 9.2 TS2M3 | |||
| Microsoft Windows Server 2008 | 9.2 TS2M3 | |||
| Microsoft Windows Server 2008 for x64 | 9.2 TS2M3 | |||
| Microsoft Windows XP Professional | 9.2 TS2M3 | |||
| Windows 7 Enterprise 32 bit | 9.2 TS2M3 | |||
| Windows 7 Enterprise x64 | 9.2 TS2M3 | |||
| Windows 7 Home Premium 32 bit | 9.2 TS2M3 | |||
| Windows 7 Home Premium x64 | 9.2 TS2M3 | |||
| Windows 7 Professional 32 bit | 9.2 TS2M3 | |||
| Windows 7 Professional x64 | 9.2 TS2M3 | |||
| Windows 7 Ultimate 32 bit | 9.2 TS2M3 | |||
| Windows 7 Ultimate x64 | 9.2 TS2M3 | |||
| Windows Vista | 9.2 TS2M3 | |||
| Windows Vista for x64 | 9.2 TS2M3 | |||
| 64-bit Enabled AIX | 9.2 TS2M3 | |||
| 64-bit Enabled HP-UX | 9.2 TS2M3 | |||
| 64-bit Enabled Solaris | 9.2 TS2M3 | |||
| HP-UX IPF | 9.2 TS2M3 | |||
| Linux | 9.2 TS2M3 | |||
| Linux for x64 | 9.2 TS2M3 | |||
| OpenVMS on HP Integrity | 9.2 TS2M3 | |||
| Solaris for x64 | 9.2 TS2M3 | |||
