Sample 43365: Overlay multiple histograms and density curves in a single cell using PROC SGPLOT
The sample code on the
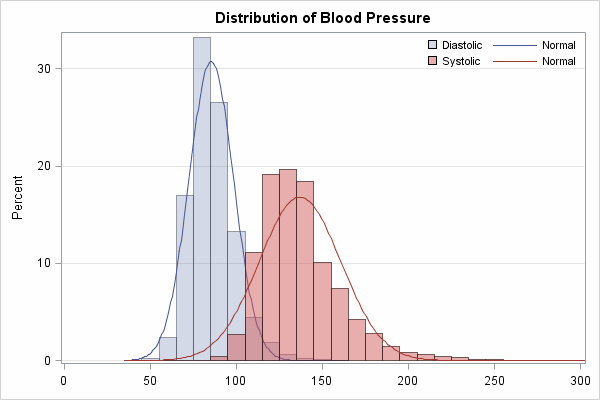
Full Code tab uses the SAS® 9.3 BINSTART and BINWIDTH options in the HISTOGRAM statement in PROC SGPLOT to control the X coordinate of the first bin and the bin width, respectively. This sample overlays two histograms and two normal density curves in the same graph cell.
These sample files and code examples are provided by SAS Institute
Inc. "as is" without warranty of any kind, either express or implied, including
but not limited to the implied warranties of merchantability and fitness for a
particular purpose. Recipients acknowledge and agree that SAS Institute shall
not be liable for any damages whatsoever arising out of their use of this material.
In addition, SAS Institute will provide no support for the materials contained herein.
The sample code below illustrates how to overlay multiple histograms and density curves in a single cell with the SGPLOT procedure.
The graphics output on the Results tab was produced using SAS® 9.3. To submit this sample code in SAS® 9.2, remove the BINSTART= and BINWIDTH= options from the HISTOGRAM statements.
title 'Distribution of Blood Pressure';

proc sgplot data=sashelp.heart;
   histogram diastolic / fillattrs=graphdata1 transparency=0.7 binstart=40 binwidth=10;
   density diastolic / lineattrs=graphdata1;
   histogram systolic / fillattrs=graphdata2 transparency=0.5 binstart=40 binwidth=10;
   density systolic / lineattrs=graphdata2;
   keylegend / location=inside position=topright noborder across=2;
   yaxis grid;
   xaxis display=(nolabel) values=(0 to 300 by 50);
run;
These sample files and code examples are provided by SAS Institute
Inc. "as is" without warranty of any kind, either express or implied, including
but not limited to the implied warranties of merchantability and fitness for a
particular purpose. Recipients acknowledge and agree that SAS Institute shall
not be liable for any damages whatsoever arising out of their use of this material.
In addition, SAS Institute will provide no support for the materials contained herein.

This sample illustrates how to overlay multiple histograms and density curves in a single cell using the SGPLOT procedure.
| Type: | Sample |
| Topic: | SAS Reference ==> Procedures ==> SGPLOT
|
| Date Modified: | 2011-06-07 15:51:08 |
| Date Created: | 2011-05-27 10:26:16 |
Operating System and Release Information
| SAS System | SAS/GRAPH | Microsoft Windows XP Professional | 9.3 TS1M0 | |
| Windows 7 Enterprise 32 bit | 9.3 TS1M0 | |
| Windows 7 Enterprise x64 | 9.3 TS1M0 | |
| Windows 7 Home Premium 32 bit | 9.3 TS1M0 | |
| Windows 7 Home Premium x64 | 9.3 TS1M0 | |
| Windows 7 Professional 32 bit | 9.3 TS1M0 | |
| Windows 7 Professional x64 | 9.3 TS1M0 | |
| Windows 7 Ultimate 32 bit | 9.3 TS1M0 | |
| Windows 7 Ultimate x64 | 9.3 TS1M0 | |
| Windows Vista | 9.3 TS1M0 | |
| Windows Vista for x64 | 9.3 TS1M0 | |
| 64-bit Enabled AIX | 9.3 TS1M0 | |
| 64-bit Enabled HP-UX | 9.3 TS1M0 | |
| 64-bit Enabled Solaris | 9.3 TS1M0 | |
| HP-UX IPF | 9.3 TS1M0 | |
| Linux | 9.3 TS1M0 | |
| Linux for x64 | 9.3 TS1M0 | |
| Solaris for x64 | 9.3 TS1M0 | |
| Microsoft Windows Server 2008 for x64 | 9.3 TS1M0 | |
| Microsoft Windows Server 2008 | 9.3 TS1M0 | |
| Microsoft Windows Server 2003 for x64 | 9.3 TS1M0 | |
| Microsoft Windows Server 2003 Standard Edition | 9.3 TS1M0 | |
| Microsoft Windows Server 2003 Enterprise Edition | 9.3 TS1M0 | |
| Microsoft Windows Server 2003 Datacenter Edition | 9.3 TS1M0 | |
| Microsoft® Windows® for x64 | 9.3 TS1M0 | |
| z/OS | 9.3 TS1M0 | |


