Sample 40009: Using report linking to display detail data in an OLAP-based SAS® Web Report Studio report
 |  |  |
Overview
To perform more in-depth analysis, users often want to drill-through to the detail records that constitute a particular crossing in an OLAP-based table. By default, drill-through queries are processed on the SAS® OLAP Server. In some cases, when the amount of data in the cube or detail table is extremely large, returning those results might cause resource and out-of-memory issues on that server.
As an alternative, you can use report linking to leverage the workspace server, which is designed to handle larger amounts of data. This sample provides some tips and techniques to make report linking between OLAP-based reports and relational (detail) reports work more efficiently.
About the sample data
This sample uses two information maps.
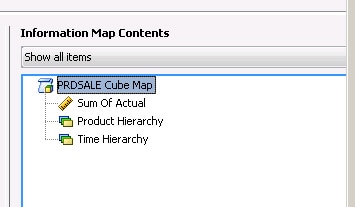
One is a multidimensional information map that is built on a simple cube, which was created from the SASHELP.PRDSALE data set. The information map contents are shown in the following display.
The other is a relational information map that is built on the SASHELP.PRDSALE data set. The relational map is used for the target report that contains the detail data. Some extra steps are recommended to prepare the relational information map.
Prepare the relational map
This section provides some tips for preparing the relational information map for linking.
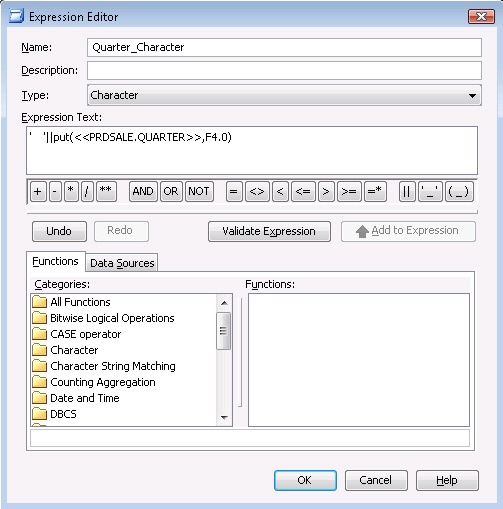
Change numeric data items to character and ensure that the format length matches what is defined in the OLAP cube
In this sample, Quarter is defined with a length of 8 in the cube, so a new data item is created to convert Quarter to character and ensure that the length is 8. One way to accomplish this is to use an expression similar to the following:
Tip: The data items that are converted to character can be set to hidden in the final report.
Create filters for each of the data items to be used in the linking
The next step is to define filters for any level of any dimension that might be displayed in the OLAP-based report. In this sample, filters were created for Product Type, Product, Year, and Quarter. The following steps illustrate the best practices for defining these filters with the All option set as default.
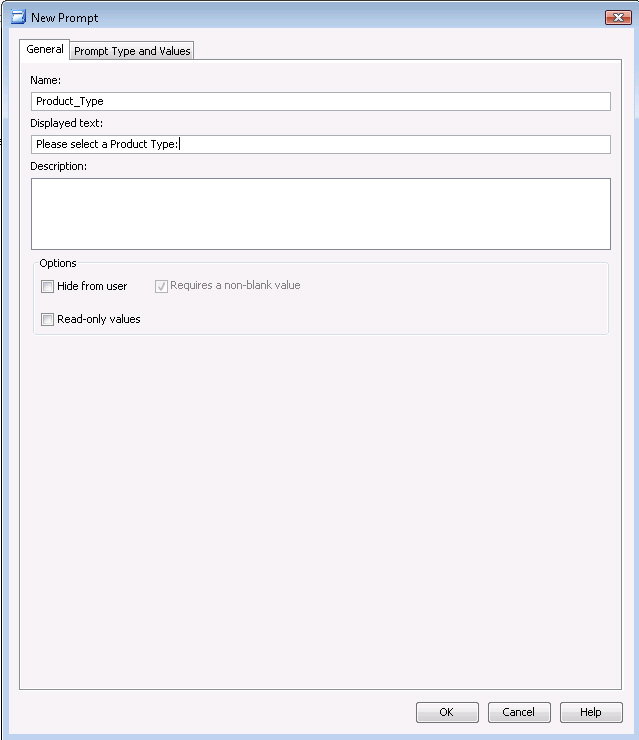
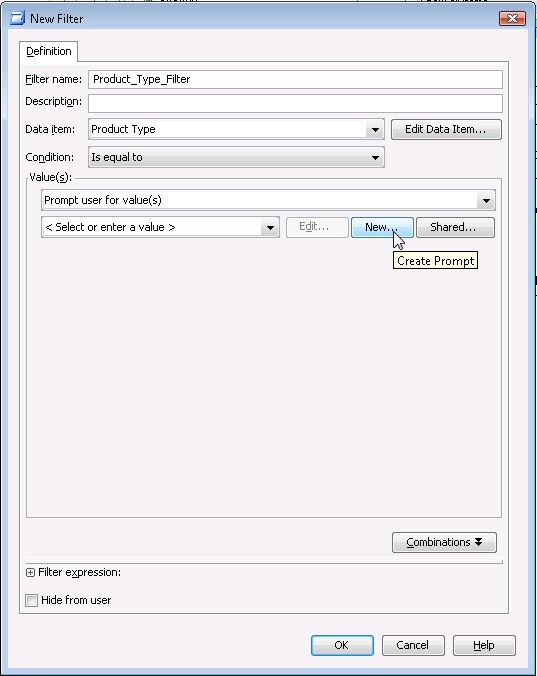
- Create a new filter that prompts the user to enter values:
- Enter a name and display text for the filter.
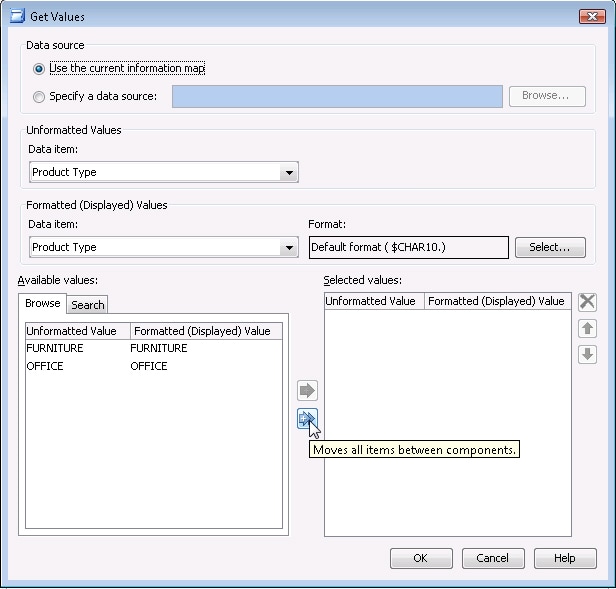
- On the Prompt Type and Values tab, select User selects values from a static list for the method for populating the prompt and select Multiple Values for the number of values. Also, check the box for All possible values. You can then click on the Get Values button to populate the values for the prompt.
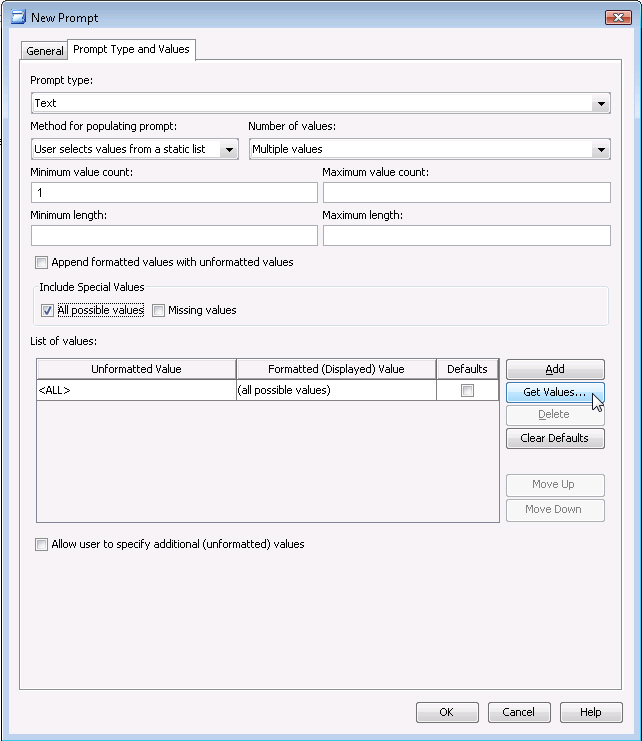
- In the Get Values dialog box, click the double arrows to select all available values and click OK.
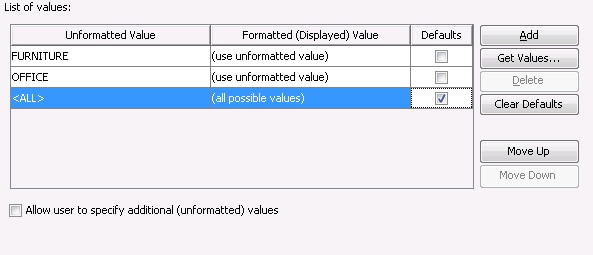
- Select All as your default value. This setting enables you to later create a report definition with all values for all data items as the default view of the report.
- Continue to click OK until you have completed your filter definition.
- Use the previous steps to create a filter for each level of any dimension that might be displayed in the OLAP-based report.
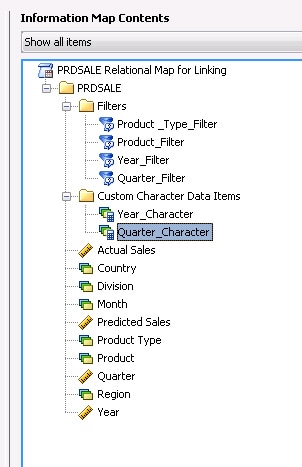
The final result
The following display shows the final relational information map based on SASHELP.PRDSALE.
Create the relational report
- In SAS Web Report Studio, create a new report based on all of the data items from the relational information map.
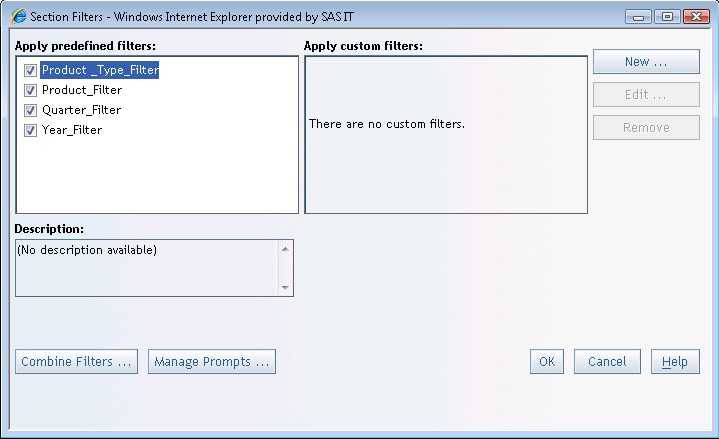
- Open the Section Filters dialog box and select all of the filters to be used in report linking.
- Design the layout, inserting a table any other objects that you want in the report.
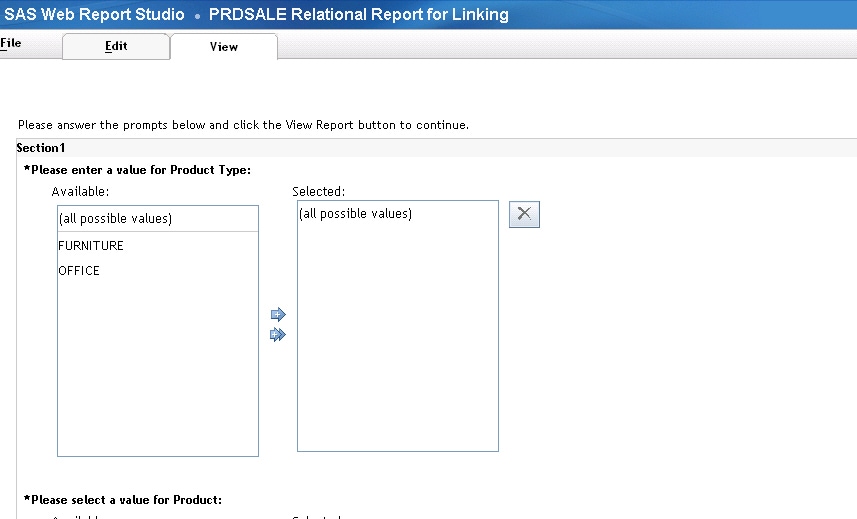
- View the report, making sure that (all possible values) is selected for each of the prompts.
- At this point, save the report in order to create a default view that includes all values for all data items.
Tip: After you have saved this view, use SAS® Management Console to deny WriteMetadata to all of the users accessing this report. This denial will prevent users from saving over your default view definition. It will also suppress the "Changes that you made to the current report have not been saved" message when navigating between the linked reports.
Create the OLAP-based report
- In the same SAS Web Report Studio session, select File ► New Report.
- Select all data items from the OLAP-based information map.
- Insert a crosstabulation table into the layout.
- Right-click on the table and select Report Linking (you must be authorized to use this feature).
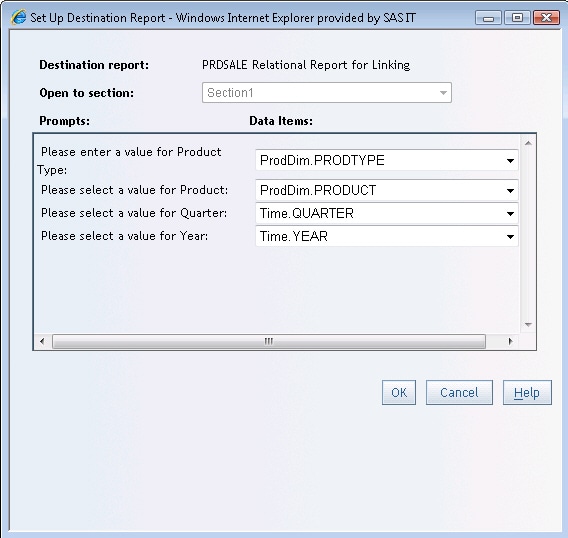
- As the target report, select the relational report, and then match up the data items in the OLAP-based report to the prompts in the relational report. This will allow your users to use report linking and pass the proper values to the prompts. (For information about the conditions that must be met in order to bypass the prompt window, see SAS Note 36631.) If a dimension is not used or not drilled to a level where that parameter is passed, the prompt window will appear with (all possible values) already filled in. The user then clicks View Report to display the relational report.
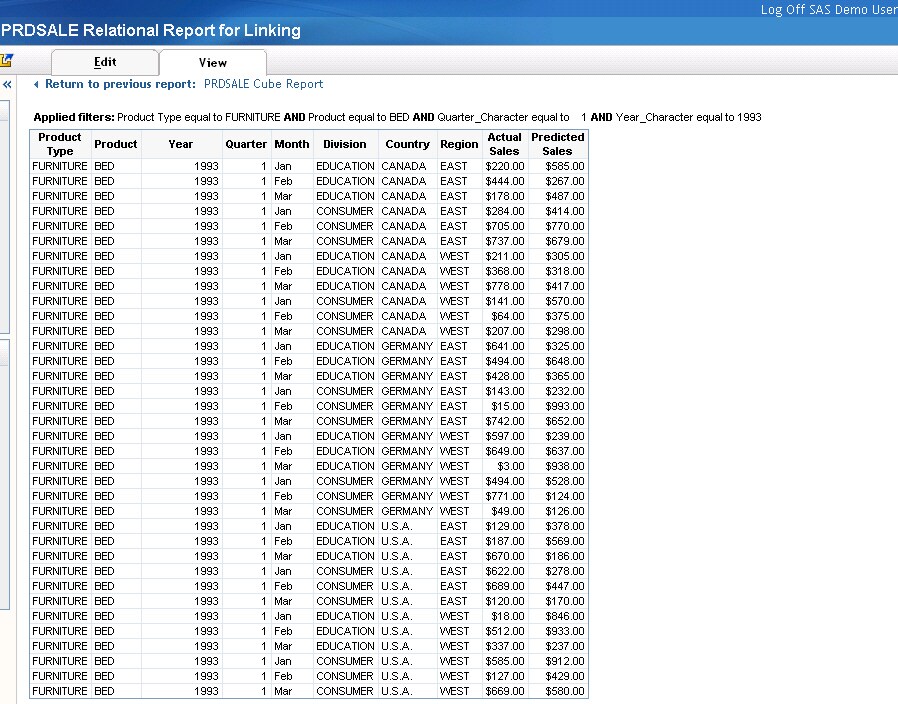
Test the linked reports
Display the OLAP-based report and click on a particular cell.
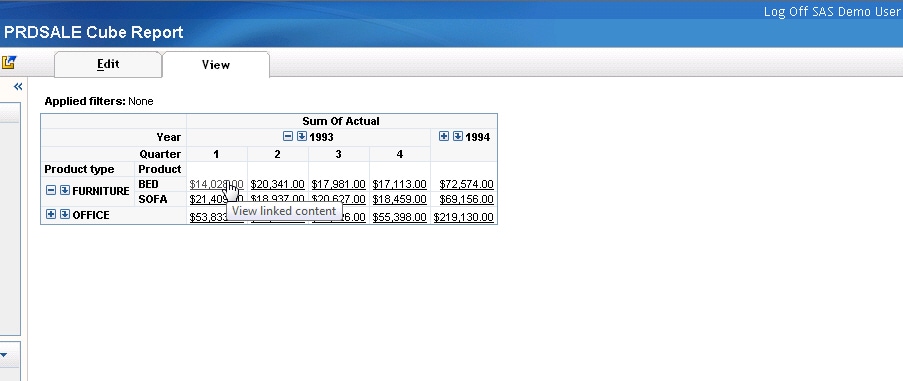
The detail records of that cell are displayed in the relational report. The report linking passes all of the proper parameters and uses (all possible values) for anything that is not passed.
Additional Documentation
For more information about SAS Web Report Studio, see the SAS Web Report Studio documentation page.
For more information about SAS Information Map Studio, see the SAS Information Map Studio documentation page.
For more information about creating cubes, see the SAS OLAP Server and SAS OLAP Cube Studio documentation pages.
For more information about SAS Management Console, see the SAS Management Console documentation page.
These sample files and code examples are provided by SAS Institute Inc. "as is" without warranty of any kind, either express or implied, including but not limited to the implied warranties of merchantability and fitness for a particular purpose. Recipients acknowledge and agree that SAS Institute shall not be liable for any damages whatsoever arising out of their use of this material. In addition, SAS Institute will provide no support for the materials contained herein.
These sample files and code examples are provided by SAS Institute Inc. "as is" without warranty of any kind, either express or implied, including but not limited to the implied warranties of merchantability and fitness for a particular purpose. Recipients acknowledge and agree that SAS Institute shall not be liable for any damages whatsoever arising out of their use of this material. In addition, SAS Institute will provide no support for the materials contained herein.
| Type: | Sample |
| Topic: | Query and Reporting ==> Interactive Querying Query and Reporting ==> OLAP (Online Analytical Processing) |
| Date Modified: | 2010-06-23 16:27:09 |
| Date Created: | 2010-06-16 09:55:36 |
Operating System and Release Information
| Product Family | Product | Host | SAS Release | |
| Starting | Ending | |||
| SAS System | SAS Web Report Studio | z/OS | ||
| Microsoft® Windows® for x64 | ||||
| Microsoft Windows 95/98 | ||||
| Microsoft Windows 2000 Advanced Server | ||||
| Microsoft Windows 2000 Datacenter Server | ||||
| Microsoft Windows 2000 Server | ||||
| Microsoft Windows 2000 Professional | ||||
| Microsoft Windows NT Workstation | ||||
| Microsoft Windows Server 2003 Datacenter Edition | ||||
| Microsoft Windows Server 2003 Enterprise Edition | ||||
| Microsoft Windows Server 2003 Standard Edition | ||||
| Microsoft Windows Server 2003 for x64 | ||||
| Microsoft Windows Server 2008 | ||||
| Microsoft Windows Server 2008 for x64 | ||||
| Microsoft Windows XP Professional | ||||
| Windows 7 Enterprise 32 bit | ||||
| Windows 7 Enterprise x64 | ||||
| Windows 7 Home Premium 32 bit | ||||
| Windows 7 Home Premium x64 | ||||
| Windows 7 Professional 32 bit | ||||
| Windows 7 Professional x64 | ||||
| Windows 7 Ultimate 32 bit | ||||
| Windows 7 Ultimate x64 | ||||
| Windows Millennium Edition (Me) | ||||
| Windows Vista | ||||
| Windows Vista for x64 | ||||
| 64-bit Enabled AIX | ||||
| 64-bit Enabled Solaris | ||||
| HP-UX IPF | ||||
| Linux | ||||
| Linux for x64 | ||||
| Solaris for x64 | ||||