Usage Note 39109: Measures and tests of the discriminatory power of a binary logistic model
 |  |  |
Tjur (2009) proposed a new goodness of fit statistic for binary logistic models which he calls the coefficient of discrimination, D. D is the difference in the average of the event probabilities between the groups of observations with observed events and nonevents. The Kolmogorov-Smirnov (KS) test is also used to assess the difference between event and nonevent groups. Both of these statistics are discussed below.
These are the properties of D according to Tjur (2009):
- Like R2, D ranges from 0 to 1.
- D ≥ 0. D = 0 if and only if all estimated probabilities are equal — the model has no discriminatory power.
- D ≤ 1. D = 1 if and only if the observed and estimated probabilities are equal for all observations — the model discriminates perfectly.
- Unlike the R-square statistic produced by PROC LOGISTIC, D will not always increase when predictors are added to the model.
Beginning in SAS® 9.4 TS1M2, this statistic can be obtained by fitting the model in PROC HPLOGISTIC. Beginning in SAS 9.4 TS1M6 it is available with the GOF option in the MODEL statement in PROC LOGISTIC.
Example
In this example used by Tjur, a logistic model is fitted to low birth weight data from Baystate Medical Center in Springfield, MA. These data are presented and analyzed in Hosmer and Lemeshow (2000) and in other places. The following statements fit the model. The RSQUARE option computes R2 statistics. The OUTPUT statement creates a data set containing the predicted event probabilities. The ROC statement fits an intercept-only (no discrimination) model to which the fitted model is compared by the ROCCONTRAST statement to provide a test of the discriminatory power of the model. The ROC and ROCCONTRAST statements are available beginning in SAS 9.2. Prior to SAS 9.2, use the ROC macro.
      proc logistic data=lbw;
        class race;
        model low(event="1") = age lwt race smoke / rsquare;
        output out=out p=p;
        roc; roccontrast;
        run;
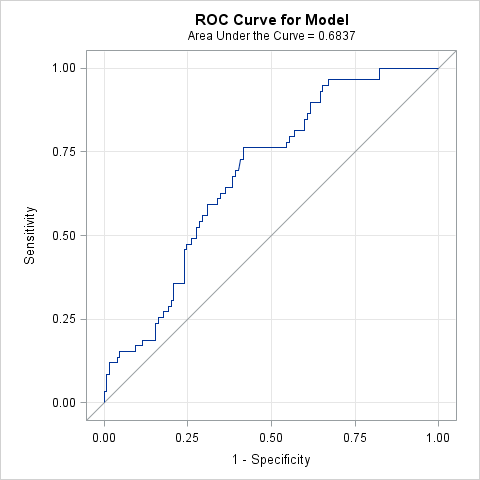
A popular measure of the discriminatory power of a logistic model, the area under the ROC curve (c), is 0.6837. The model displays significant discriminatory power (chi-square = 21.9010, p <.0001). The c statistic is also known as the concordance index and is an estimate of the probability of concordance for a pair of observations. For more on concordance and the concordance index, see "Rank Correlation of Observed Responses and Predicted Probabilities" in the Details section of the LOGISTIC documentation.
The R2 statistic, which is the Cox-Snell statistic mentioned by Tjur on page 371, is 0.1009, and the Nagelkerke adjusted R2 is 0.1418. Note that R2 cannot be interpreted as the "proportion of variation explained" as in linear regression with ordinary least squares. In the context of logistic regression, R2 is most useful as a measure for comparing competing models.

|
||||||||||||||||||||||||||||||||||||||||||||||||||||
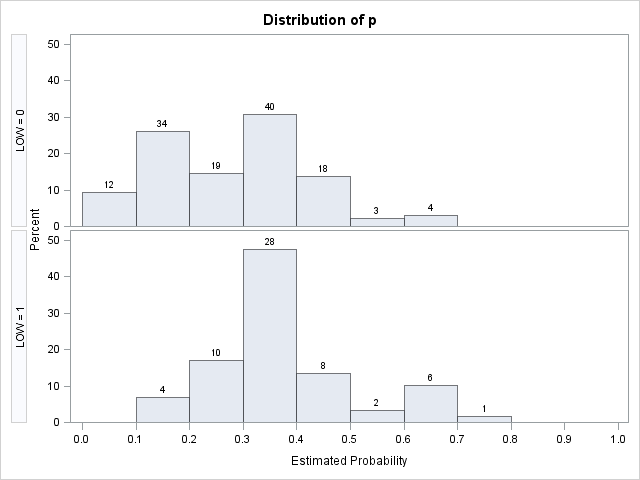
These statements create the comparative histogram shown by Tjur on page 370.
      proc univariate data=out noprint;
        class low;
        histogram p / endpoints=(0 to 1 by .1) barlabel=count;
        run;
Each histogram shows the distribution of the the predicted probabilities of low birth weight under the model. The bottom histogram of low birth weight babies shows about a 10% shift toward higher probabilities of low birth weight compared to the top histogram of normal weight babies. A good model is evidenced by strong separation of these two distributions. In this case, the distributions overlap considerably suggesting the model has low explanatory power.
 |
The coefficient of discrimination quantifies the separation in the two distributions. It is simply the difference in the average event probabilities for the two response groups.
In PROC HPLOGISTIC, the PARTITION statement is required to produce this statistic, but partitioning of the data can be avoided by specifying zero-sized test and validation partitions. In this way, all of the data is retained in the training data set. For the example above, these statements produce the coefficient of discrimination which is labeled as the Mean Difference in the Partition Fit Statistics table. Several other fit statistics are also presented.
      proc hplogistic data=lbw;
        class race;
        model low(event="1") = age lwt race smoke ;
        partition fraction(test=0 validate=0);
        run;
|
||||||||||||||||||||||||||
Since the Tjur statistic is just a difference of means, it can also be produced using the TTEST procedure. The following statements produce the statistic. Since LOW=1 represents the event and this level occurs after LOW=0 in the data, the following PROC SORT step reverses this order. Specifying the ORDER=DATA option uses the new order so that TTEST computes the event mean minus the nonevent mean. The PROC SORT step and ORDER=DATA option are not needed if the event level is coded as the first level when sorted. Only the Statistics table from TTEST is needed to display Tjur's mean difference and the ODS SELECT statement limits the display to this table.
      proc sort data=out out=out2;
        by descending low;
        run;
      proc ttest data=out2 order=data;
        ods select statistics;
        class low; var p;
        run;
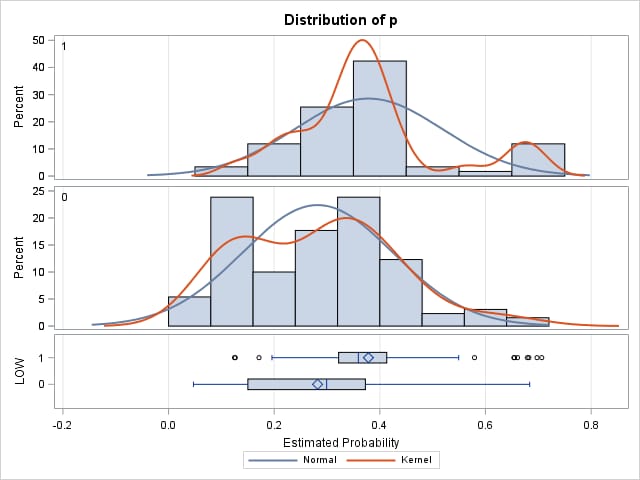
If desired, you can also display a comparative histogram plot similar to that shown above using these statements.
      proc ttest data=out2 plots=summary order=data;
        ods select statistics summarypanel;
        class low; var p;
        run;
 |
Tjur's D statistic can also be produced using the following macro. The following statements define the macro CoefDisc, which has three required arguments.
- The DATA= argument is the data set name from the OUT= option of the OUTPUT statement in PROC LOGISTIC. Note that the macro cannot be used with events/trial data in which each observation represents a set of actual observations.
- The P= argument is the variable name specified in the P= option of the OUTPUT statement.
- RESPONSE= is the name of the response variable specified in the MODEL statement.
- The fourth argument, PLOTS=, is optional. If omitted (or if you specify PLOTS=TJUR), the comparative histogram shown above is produced. Specify PLOTS=NONE to suppress the plot.
Submit these statements to define the macro and make it available for use.
      %macro CoefDisc (data=, p=, response=, plots=tjur);
         data _null_;
           set &data;
           call symput("event",cats(_level_));
           stop;
           run;
         proc summary data=&data nway;
           class &response;
           var &p;
           output out=_mns mean=avep;
           run;
         data _null_;
           set _mns;
           _response=put(&response,32.);
           if cats(_response) ne "&event" then call symput("nonevent",cats(&response));
           run;
         proc transpose data=_mns out=_tmns prefix=&response;
           var avep; id &response;
           run;
         data _rsq;
           set _tmns;
           D=&response.&event-&response.&nonevent;
           run;
         %if %upcase(&plots)=TJUR %then %do;
           proc univariate data=&data noprint;
             class &response;
             histogram &p / endpoints=(0 to 1 by .1);
             run;
         %end;
         proc print noobs;
           var D &response.&event &response.&nonevent;
           title "Coefficient of Discrimination (D) and average probabilities";
           run;
      %mend;
The following statement calls the CoefDisc macro for this example and computes the D statistic and the average event probabilities for the group of observed events and the group of observed nonevents.
%CoefDisc(data=out, p=p, response=low)
The value of D (0.0962) confirms the visual impression of a 10% shift in the predicted probabilities of low birth weight seen in the comparative histogram. The average predicted probability of low birth weight under the model for the group of babies observed to have low birth weight is 0.3784. The average predicted probability of low birth weight under the model for the group of babies observed to have normal birth weight is 0.2821.
|
Another example of computing Tjur's statistic can be found in Allison (2012).
Kolmogorov-Smirnov (KS) test
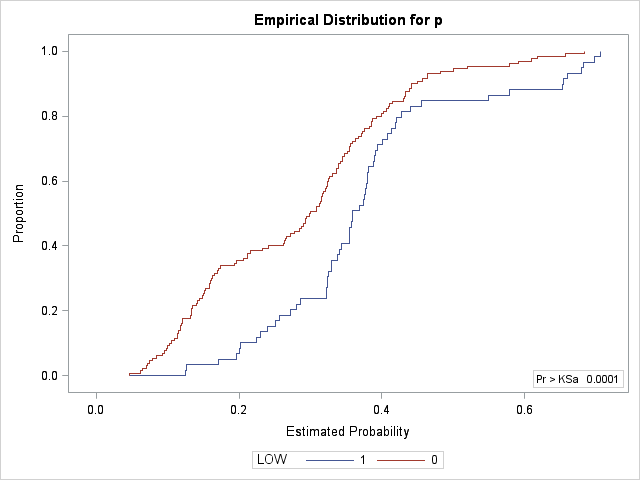
Nonparametric tests of the location shift between the two distributions of predicted event probabilities can be performed using PROC NPAR1WAY. The Kolmogorov-Smirnov (KS) test is sometimes proposed to test for differences in the two distribution functions and thereby test if the logistic model separates (discriminates between) the two responses. This test is provided by the EDF option. However, the KS test rejects equality of the two distributions for any difference such as a shape difference, not just a shift in location which is of primary interest. Since the Wilcoxon test concentrates its power on detecting location shift it may be more suitable. The WILCOXON option provides this test. Note that the area under the ROC curve is related to the Wilcoxon statistic.
      proc npar1way data=out wilcoxon edf;
        class low;
        var p;
        run;
Both tests detect a significant difference in the two distributions. The plot of the empirical distribution functions provides another visual comparison of the two distributions, but the comparative histogram is better at showing the shift in location.
 |
||||||||||||||||||||||||||||||||||||
_____
Tjur, T. (2009), "Coefficients of Determination in Logistic Regression Models — A New Proposal: The Coefficient of Discrimination," The American Statistician, 63(4), 366-372.
Operating System and Release Information
| Product Family | Product | System | SAS Release | |
| Reported | Fixed* | |||
| SAS System | SAS/STAT | z/OS | ||
| OpenVMS VAX | ||||
| Microsoft® Windows® for 64-Bit Itanium-based Systems | ||||
| Microsoft Windows Server 2003 Datacenter 64-bit Edition | ||||
| Microsoft Windows Server 2003 Enterprise 64-bit Edition | ||||
| Microsoft Windows XP 64-bit Edition | ||||
| Microsoft® Windows® for x64 | ||||
| OS/2 | ||||
| Microsoft Windows 95/98 | ||||
| Microsoft Windows 2000 Advanced Server | ||||
| Microsoft Windows 2000 Datacenter Server | ||||
| Microsoft Windows 2000 Server | ||||
| Microsoft Windows 2000 Professional | ||||
| Microsoft Windows NT Workstation | ||||
| Microsoft Windows Server 2003 Datacenter Edition | ||||
| Microsoft Windows Server 2003 Enterprise Edition | ||||
| Microsoft Windows Server 2003 Standard Edition | ||||
| Microsoft Windows Server 2008 | ||||
| Microsoft Windows XP Professional | ||||
| Windows 7 Enterprise 32 bit | ||||
| Windows 7 Enterprise x64 | ||||
| Windows 7 Home Premium 32 bit | ||||
| Windows 7 Home Premium x64 | ||||
| Windows 7 Professional 32 bit | ||||
| Windows 7 Professional x64 | ||||
| Windows 7 Ultimate 32 bit | ||||
| Windows 7 Ultimate x64 | ||||
| Windows Millennium Edition (Me) | ||||
| Windows Vista | ||||
| 64-bit Enabled AIX | ||||
| 64-bit Enabled HP-UX | ||||
| 64-bit Enabled Solaris | ||||
| ABI+ for Intel Architecture | ||||
| AIX | ||||
| HP-UX | ||||
| HP-UX IPF | ||||
| IRIX | ||||
| Linux | ||||
| Linux for x64 | ||||
| Linux on Itanium | ||||
| OpenVMS Alpha | ||||
| OpenVMS on HP Integrity | ||||
| Solaris | ||||
| Solaris for x64 | ||||
| Tru64 UNIX | ||||
| Type: | Usage Note |
| Priority: | |
| Topic: | Analytics ==> Regression SAS Reference ==> Procedures ==> LOGISTIC Analytics ==> Categorical Data Analysis Analytics ==> Statistical Graphics SAS Reference ==> Procedures ==> HPLOGISTIC |
| Date Modified: | 2019-05-07 11:17:27 |
| Date Created: | 2010-03-22 12:53:08 |