Sample 36930: Bootstrap Computations in SAS/IML Studio
 |  |  |  |
Purpose
Show how to use bootstrap methods in SAS/IML Studio to compute both a bootstrap estimate for a statistic and also an estimate for the standard error of the statistic. In this example, the statistic is a 25% trimmed mean. This program demonstrates how to write a very simple bootstrap program in IMLPlus.
Requirements
SAS/IML Studio 3.2 or SAS Stat Studio 3.1 and Base SAS.
Usage
Run the IMLPlus program (Bootstrap.sx) contained in the attached zip file in a SAS/IML Studio program window. The default data set is an artificial data set, but you can run the program on your own data by changing the parameters of the program. For example, to run the program on the SASHELP.CARS data set to compute bootstrap estimates for the 25% trimmed mean for the MPG_HIGHWAY variable based on 500 bootstrap replicates, you can change the parameters of the program to the following:
   libref = "sashelp";
   DataSetName = "cars";
   YVarName = "mpg_highway";
   NumBootSamples = 500;
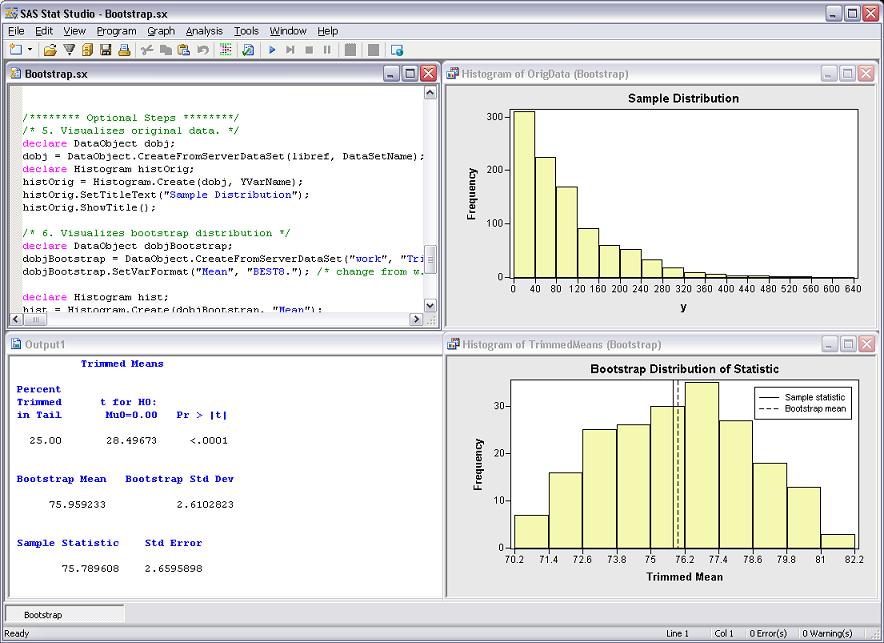
The results of running the attached IMLPlus program are shown in the Results tab.
Details
In the basic bootstrap algorithm, you sample (with replacement) from the data. For each bootstrap sample, you compute a statistic for that sample. The union of the statistics forms the bootstrap distribution. The mean of the bootstrap distribution is an estimate of the statistic on the original data. The standard deviation of the bootstrap distribution is the bootstrap estimate of the standard error of the statistic.
The program consists of the following steps:
- Generate a statistic for the original data. For this example, the statistic is a 25% trimmed mean.
- Resample from the original data. In this program the resampling is implemented in SAS/IML, but you can also resample by using the SURVEYSELECT procedure. Resampling with the SURVEYSELECT procedure is discussed in Cassell (2007) and Wicklin (2008).
- Compute the statistic for each bootstrap sample. In this step, the analysis in Step 1 is repeated for each BY group.
- Compute the mean and standard deviation of the bootstrap distribution. The bootstrap distribution approximates the distribution of the underlying statistic. The standard deviation of the bootstrap statistics estimates the standard error of the statistic.
All of the preceding steps use standard SAS/IML statements coupled with SUBMIT statements that call SAS procedures to compute statistics. The following (optional) steps in the program create IMLPlus graphics to visualize the original data, the bootstrap distribution, and the various statistics:
- Visualize the original data by creating a histogram.
- Visualize the bootstrap distribution by creating a second histogram.
- Add lines to the second histogram that indicate the sample statistic and the mean of the bootstrap distribution.
The program can be further extended by using the 5th and 95th percentiles of the bootstrap distribution to approximate a 90% confidence interval for the parameter.
References
Cassell, David L. (2007), "Don't Be Loopy: Re-Sampling and Simulation the SAS Way," Proceedings of the SAS Global Forum 2007 Conference. Cary, NC: SAS Institute Inc.
Wicklin, Rick (2008), "SAS Stat Studio: A Programming Environment for High-End Data Analysts," Proceedings of the SAS Global Forum 2008 Conference. Cary, NC: SAS Institute Inc.
These sample files and code examples are provided by SAS Institute Inc. "as is" without warranty of any kind, either express or implied, including but not limited to the implied warranties of merchantability and fitness for a particular purpose. Recipients acknowledge and agree that SAS Institute shall not be liable for any damages whatsoever arising out of their use of this material. In addition, SAS Institute will provide no support for the materials contained herein.
These sample files and code examples are provided by SAS Institute Inc. "as is" without warranty of any kind, either express or implied, including but not limited to the implied warranties of merchantability and fitness for a particular purpose. Recipients acknowledge and agree that SAS Institute shall not be liable for any damages whatsoever arising out of their use of this material. In addition, SAS Institute will provide no support for the materials contained herein.
Below is an image showing the results from the Bootstrap.sx program.
| Type: | Sample |
| Topic: | Analytics ==> Matrix Programming |
| Date Modified: | 2009-08-25 14:25:20 |
| Date Created: | 2009-08-20 11:38:16 |
Operating System and Release Information
| Product Family | Product | Host | SAS Release | |
| Starting | Ending | |||
| SAS System | SAS/IML Studio | Microsoft Windows Server 2003 Datacenter Edition | ||
| Microsoft® Windows® for x64 | ||||
| Microsoft Windows Server 2003 Enterprise Edition | ||||
| Microsoft Windows Server 2003 Standard Edition | ||||
| Microsoft Windows Server 2008 | ||||
| Microsoft Windows XP Professional | ||||
| Windows Vista | ||||