Sample 36180: Creating KPI dashboards using custom add-in tasks in SAS® Enterprise Guide® 4.2 or 4.3
 |  |  |  |  |  |
Overview
Beginning with SAS Enterprise Guide 4.1, you could generate multiple SAS Report task results that could be arranged into a SAS Report that resembled a dashboard. However, you were limited to bar charts, plots, pie charts, and tabular reports for your dashboards.
Beginning with SAS 9.2, using a new SAS/GRAPH® procedure called PROC GKPI, you can create key performance indicator (KPI) charts, which some consider more appropriate for building dashboards.
This sample includes two downloadable custom add-in tasks: one for SAS Enterprise Guide 4.2 and one for SAS Enterprise Guide 4.3. You can use the tasks to create KPI charts, which can then be used to build professional-looking dashboards.
The dashboards can then be e-mailed, exported as HTML or PDF, or published and then viewed in SAS® Web Report Studio.
Additional Documentation
For more information about using SAS Enterprise Guide, see the SAS Enterprise Guide documentation page.
These sample files and code examples are provided by SAS Institute Inc. "as is" without warranty of any kind, either express or implied, including but not limited to the implied warranties of merchantability and fitness for a particular purpose. Recipients acknowledge and agree that SAS Institute shall not be liable for any damages whatsoever arising out of their use of this material. In addition, SAS Institute will provide no support for the materials contained herein.
The following code, excluding the initial DATA step for creating input test data, shows sample code that was generated by the KPI custom add-in task.
This code will run "as is" on a machine with SAS 9.2 that includes SAS/GRAPH.
data gkpi;
input North_Sales North_Target;
cards;
750 600
;
run;

data actual_1;
set GKPI;
call symput("mac_actual_1",'North_Sales'n);
call symput("mac_target_1",'North_Target'n);
run;

data bounds;
if &mac_actual_1 < 0 then do;
  if &mac_actual_1 > -1 then do;
    call symput("mac_b1",-1.00);
    call symput("mac_b2",-.75);
    call symput("mac_b3",-.25);
    call symput("mac_b4",0);
  end;
  else if &mac_actual_1 > -10 then do;
    call symput("mac_b1",-10);
    call symput("mac_b2",-7.5);
    call symput("mac_b3",-2.5);
    call symput("mac_b4",0);
  end;  else if &mac_actual_1 > -25 then do;
    call symput("mac_b1",-25);
    call symput("mac_b2",-20);
    call symput("mac_b3",-10);
    call symput("mac_b4",0);
  end;
  else if &mac_actual_1 > -50 then do;
    call symput("mac_b1",-50);
    call symput("mac_b2",-35);
    call symput("mac_b3",-15);
    call symput("mac_b4",0);
  end;
  else if &mac_actual_1 > -75 then do;
    call symput("mac_b1",-75);
    call symput("mac_b2",-50);
    call symput("mac_b3",-25);
    call symput("mac_b4",0);
  end;
  else if &mac_actual_1  > -100 then do;
    call symput("mac_b1",-100);
    call symput("mac_b2",-75);
    call symput("mac_b3",-25);
    call symput("mac_b4",0);
  end;
  else if &mac_actual_1  > -1000 then do;
    call symput("mac_b1",-1000);
    call symput("mac_b2",-750);
    call symput("mac_b3",-250);
    call symput("mac_b4",0);
  end;
  else if &mac_actual_1  > -10000 then do;
    call symput("mac_b1",-10000);
    call symput("mac_b2",-7500);
    call symput("mac_b3",-2500);
    call symput("mac_b4",0);
  end;
  else do;
    b1=round(&mac_actual_1*2,1000);
    call symput("mac_b1",b1);
    b2=round(b1/2);
    call symput("mac_b2",b2);
    b3=round(b2/2);
    call symput("mac_b3",b3);
    call symput("mac_b4",0);
  end;
end;
else if &mac_actual_1  >=0 then do;
  if &mac_actual_1  <=1 then do;
    call symput("mac_b1",0);
    call symput("mac_b2",.25);
    call symput("mac_b3",.75);
    call symput("mac_b4",1);
  end;
  else if &mac_actual_1  <=10 then do;
    call symput("mac_b1",0);
    call symput("mac_b2",2.5);
    call symput("mac_b3",7.5);
    call symput("mac_b4",10);
  end;
  else if &mac_actual_1  <=25 then do;
    call symput("mac_b1",0);
    call symput("mac_b2",10);
    call symput("mac_b3",20);
    call symput("mac_b4",25);
  end;
  else if &mac_actual_1  <=50 then do;
    call symput("mac_b1",0);
    call symput("mac_b2",15);
    call symput("mac_b3",35);
    call symput("mac_b4",50);
  end;
  else if &mac_actual_1  <=75 then do;
    call symput("mac_b1",0);
    call symput("mac_b2",25);
    call symput("mac_b3",50);
    call symput("mac_b4",75);
  end;
  else if &mac_actual_1  <=100 then do;
    call symput("mac_b1",0);
    call symput("mac_b2",25);
    call symput("mac_b3",75);
    call symput("mac_b4",100);
  end;
  else if &mac_actual_1  <=1000 then do;
    call symput("mac_b1",0);
    call symput("mac_b2",250);
    call symput("mac_b3",750);
    call symput("mac_b4",1000);
  end;
  else if &mac_actual_1  <=10000 then do;
    call symput("mac_b1",0);
    call symput("mac_b2",2500);
    call symput("mac_b3",7500);
    call symput("mac_b4",10000);
  end;
  else if &mac_actual_1  <=100000 then do;
    call symput("mac_b1",0);
    call symput("mac_b2",25000);
    call symput("mac_b3",75000);
    call symput("mac_b4",100000);
  end;
  else if &mac_actual_1  <=1000000 then do;
    call symput("mac_b1",0);
    call symput("mac_b2",250000);
    call symput("mac_b3",750000);
    call symput("mac_b4",1000000);
  end;
  else if  &mac_actual_1 <=10000000 then do;
    call symput("mac_b1",0);
    call symput("mac_b2",2500000);
    call symput("mac_b3",7500000);
    call symput("mac_b4",10000000);
  end;
  else if &mac_actual_1  <=100000000 then do;
    call symput("mac_b1",0);
    call symput("mac_b2",25000000);
    call symput("mac_b3",75000000);
    call symput("mac_b4",100000000);
  end;
end;
run;

goptions reset=all device=javaimg vsize= 2.50 in hsize= 2.50 in;

proc gkpi mode=raised;
 speedometer actual=&mac_actual_1 bounds= (&mac_b1 &mac_b2 &mac_b3 &mac_b4) /
 target=&mac_target_1
 label='North Sales' lfont=( h= 20 PT c= CX3366FF)
 colors=(cxD06959  cxF1DC63  cx84AF5B );
run;
quit;
These sample files and code examples are provided by SAS Institute Inc. "as is" without warranty of any kind, either express or implied, including but not limited to the implied warranties of merchantability and fitness for a particular purpose. Recipients acknowledge and agree that SAS Institute shall not be liable for any damages whatsoever arising out of their use of this material. In addition, SAS Institute will provide no support for the materials contained herein.
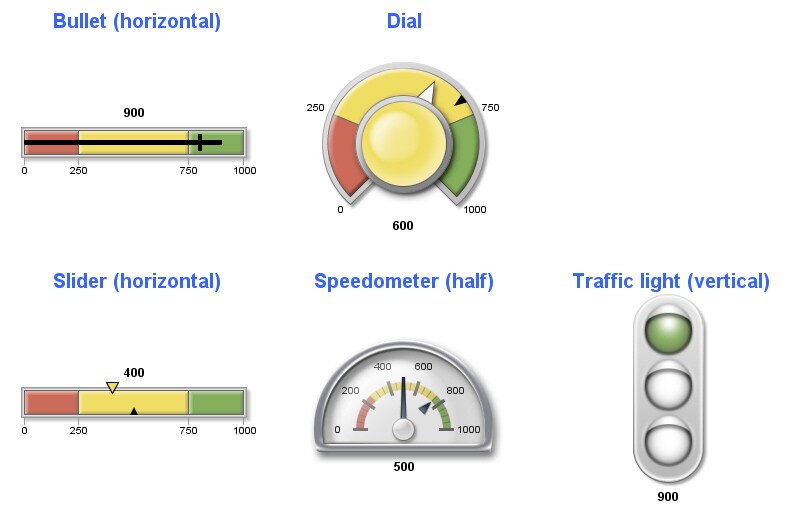
PROC GKPI can generate the following five KPI chart types:
- Bullet (vertical and horizontal)
- Dial
- Slider (vertical and horizontal)
- Speedometer (quarter, half, and full)
- Traffic light (vertical and horizontal)
The following display shows all five KPI chart types generated by the KPI custom add-in task:

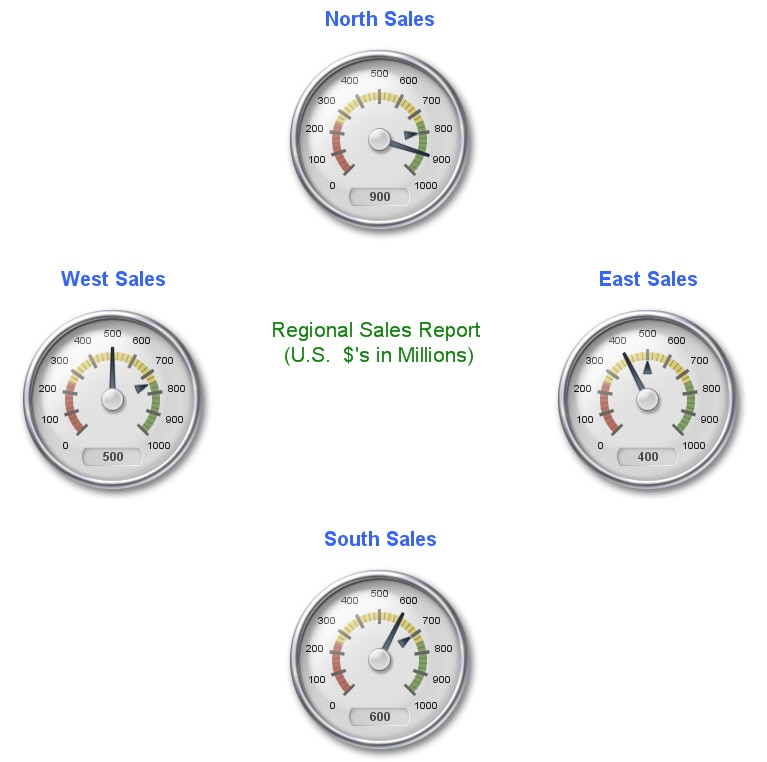
The following display shows a sample SAS Report dashboard with KPI charts arranged geographically:
You can arrange your dashboard differently within the SAS Report Editor.

To install and use the custom add-in task, follow these steps:
- Log on to your SAS Enterprise Guide 4.2 (or later) client machine.
- Close SAS Enterprise Guide.
- For SAS Enterprise Guide 4.2, click the following link to retrieve and save the .dll file.
- Save the .dll file to your SAS Enterprise Guide client machine.
- Start SAS Enterprise Guide.
- Select Tools ► Add-In ► Add-In Manager ► Browse.
- Select and open the .dll file, then click OK to close the Add-In Manager tool.
- Open some data for the task.
The task input data requires only one row in a numeric column used for the Task role, Actual.
The input data can also include a second numeric column used for the optional Task role, Target.
- Open the KPI task by selecting Tools ► Add-In ► KPI - custom add-in.
- If you want to build a dashboard, then use the KPI task to create a few chart results.
- After the charts are created, select File ► New ► Report.
- Select and drag the charts into the Report Layout window, then click OK when you are finished.
- You can now Modify/Edit, Export, Send To (E-Mail), or Publish the SAS Report dashboard.
Make sure the file name is saved as SAS.Tasks.Examples.GKPI.dll
For SAS Enterprise Guide 4.3, click the following link to retrieve and save the .dll file.
Make sure the file name is saved as SAS.Tasks.Examples.GKPI43.dll
This display shows sample input data, for both Task roles Actual and Target, that could be used to create four KPI charts:

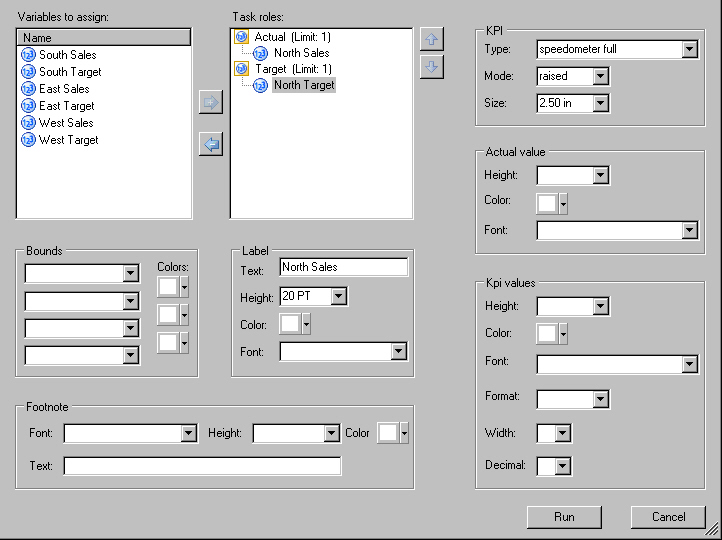
This display shows the user interface of the KPI custom add-in task:

| Type: | Sample |
| Date Modified: | 2009-06-26 12:49:54 |
| Date Created: | 2009-06-09 09:24:34 |
Operating System and Release Information
| Product Family | Product | Host | Product Release | SAS Release | ||
| Starting | Ending | Starting | Ending | |||
| SAS System | SAS Enterprise Guide | Microsoft® Windows® for x64 | 4.2 | 9.2 TS2M0 | ||
| Microsoft Windows Server 2003 Datacenter Edition | 4.2 | 9.2 TS2M0 | ||||
| Microsoft Windows Server 2003 Enterprise Edition | 4.2 | 9.2 TS2M0 | ||||
| Microsoft Windows Server 2003 Standard Edition | 4.2 | 9.2 TS2M0 | ||||
| Microsoft Windows XP Professional | 4.2 | 9.2 TS2M0 | ||||
| Windows Vista | 4.2 | 9.2 TS2M0 | ||||