Sample 35156: Heat maps
 |  |  |  |  |
This samples uses the Graph Template Language (GTL) to produce heat maps using a two-column lattice layout and scatter plots. The graph on the left shows emerging issues by date and period in service. The graph on the right is a gene expression graph.
These sample files and code examples are provided by SAS Institute Inc. "as is" without warranty of any kind, either express or implied, including but not limited to the implied warranties of merchantability and fitness for a particular purpose. Recipients acknowledge and agree that SAS Institute shall not be liable for any damages whatsoever arising out of their use of this material. In addition, SAS Institute will provide no support for the materials contained herein.
This samples uses the Graph Template Language (GTL) to produce heat maps using a two-column lattice layout and scatter plots. The graph on the left shows emerging issues by date and period in service. The graph on the right is a gene expression graph.
proc format;
  value zval 1='Potential Problem'
             2='Emerging Issue'
             other=.;
run;

data wu;
  format x date9.;
  format z  zl zval.;
  keep x y z zl;
  do i=1 to 12;
    do j=0 to 12-i;
      x=j * 15 + '01Jan2006'd;
      y=i;
      z=int(8 * abs(ranuni(0))) + 1;
      *--Set values over 2 to 3, to get more white boxes--;
      *--ZL var has values of only 1 & 2 for the legend--;
      if z > 2 then do;
        z=3;
	zl=.;
      end;
      else zl=z;
      output;
    end;
  end;
run;

proc sort data=wu out=sasuser.wu2;
  by z;
run;

data _null_;
  length widthopt $5;
  w=300;
  h=280;
  wopt=cat(put(2*w, 4.0), 'px');
  hopt=cat(put(h, 4.0), 'px');
  size1=(1.0*0.9*h / 12) - 5;
  sizeL=0.5*size1;
  size2=(1.0*0.9*h / 20) +1;
  put 'W_opt= ' wopt;
  put 'H_opt= ' hopt;
  put 'size1= ' size1;
  put 'sizeL= ' sizeL;
  put 'size2= ' size2;
  call symput ("wopt", wopt);
  call symput ("hopt", hopt);
  call symput ("size1", size1);
  call symput ("sizeL", sizeL);
  call symput ("size2", size2);
run;

/*--Simulate data for Genomic Heat Map--*/
data genome (keep=gene name val);
  length Gene $12;
  length Name $ 8;
  length e s r $3;
  format val 8.5;
  retain pi 3.1415;
  do i=1 to 25;
    e = put (int (max (min (1000* ranuni(0), 999),1) ), z3.0);
    s = put (int (max (min (1000* ranuni(0), 999),1) ), z3.0);
    r = put (int (max (min (1000* ranuni(0), 999),1) ), z3.0);
    gene='E' || e || 'S' || s || 'R' || r;
    offset=0.5 + 0.7*ranuni(0);
    do j = 1 to 20;
      Name=put (j, 3.);
      val = max(min(offset + 2*(1+cos(j*PI/23+0.3*ranuni(0))) + 2*(1+sin((i+3)*PI/15+0.7*ranuni(0))),9),1);
      val2 = 2.0 * ((val / 10) - 0.5);
      val = ((val2 * abs(val2)) + 0.5) * 8;
      output;
    end;
  end;
run;

/*--Merge datgsets to make both heat maps in on graph--*/
data sasuser.grid;
  merge sasuser.wu2 genome;
run;

proc template;
  define statgraph sgf2009.Grid;
  mvar wopt hopt;
  nmvar size1 size2 sizeL;
  begingraph / designwidth=wopt designheight=hopt;
  entrytitle "Heat Maps with Discrete Axes";
  layout gridded / columns=2 columngutter=5px order=rowmajor pad=5px;
    entry "Emerging Issues" / textattrs=GraphlabelText;
    entry "DNA Microarray" / textattrs=GraphlabelText;
  layout overlay / xaxisopts=(type=time label='Build Period')
                   yaxisopts=(type=discrete label='Periods in Service') border=true pad=(top=5px right=5px);
    scatterplot x=x y=y / group=zl markerattrs=(symbol=squarefilled size=sizeL) name='s1' includemissinggroup=false;
    scatterplot x=x y=y / group=z markerattrs=(symbol=squarefilled size=size1) name='s3' includemissinggroup=false;
    scatterplot x=x y=y / markerattrs=(symbol=square size=size1);
    discretelegend 's1' / location=outside halign=right valign=center across=1;
  endlayout;
  layout overlay / border=true xaxisopts=(label='Samples' ) pad=(top=5px bottom=0px right=15px);
    scatterplot x=name y=gene / markercolorgradient=val markerattrs=(symbol=squarefilled size=size2)
                                colormodel=threecolorramp name='s2';
    continuouslegend 's2' / orient=vertical location=outside valign=center halign=right valuecounthint=10;
  endlayout;
  endlayout;
endgraph;
end;
run;

proc template;
  define Style HeatMapStyle;
    parent = styles.harvest;
    style GraphFonts from GraphFonts
      "Fonts used in graph styles" /
      'GraphTitleFont' = (", ",10pt,bold)
      'GraphFootnoteFont' = (", ",8pt)
      'GraphLabelFont' = (", ",7pt)
      'GraphValueFont' = (", ",5pt)
      'GraphDataFont' = (", ",5pt);
    style GraphColors from graphcolors /
      "gcdata1" = cxaf1515
      "gcdata2" = cxeabb14
      "gcdata3" = cxffffff
      "gramp3cend" = cxaa081b
      "gramp3cneutral" = cx000000
      "gramp3cstart" = cx1ba808;
  end;
run;

title;

ods listing close;
ods html style=HeatMapStyle image_dpi=100 file='heatmap.html' path='c:\samples\gtl';

ods graphics on / reset imagename='GTLHandout_Heatmaps' imagefmt=gif;
proc sgrender data=sasuser.grid template=sgf2009.grid;
run;

ods html close;
ods listing;
These sample files and code examples are provided by SAS Institute Inc. "as is" without warranty of any kind, either express or implied, including but not limited to the implied warranties of merchantability and fitness for a particular purpose. Recipients acknowledge and agree that SAS Institute shall not be liable for any damages whatsoever arising out of their use of this material. In addition, SAS Institute will provide no support for the materials contained herein.
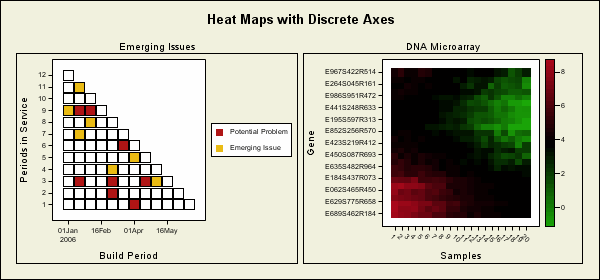
This samples uses the Graph Template Language (GTL) to produce heat maps using a two-column lattice layout and scatter plots. The graph on the left shows emerging issues by date and period in service. The graph on the right is a gene expression graph.
| Type: | Sample |
| Topic: | SAS Reference ==> Procedures ==> SGRENDER Query and Reporting ==> Creating Reports ==> Graphical ==> Graph Template Language (GTL) Query and Reporting ==> Creating Reports ==> Graphical ==> Health and Life Sciences Industry |
| Date Modified: | 2009-03-19 10:15:54 |
| Date Created: | 2009-03-17 10:31:00 |
Operating System and Release Information
| Product Family | Product | Host | SAS Release | |
| Starting | Ending | |||
| SAS System | SAS/GRAPH | z/OS | 9.2 TS1M0 | |
| Microsoft® Windows® for 64-Bit Itanium-based Systems | 9.2 TS1M0 | |||
| Microsoft Windows Server 2003 Datacenter 64-bit Edition | 9.2 TS1M0 | |||
| Microsoft Windows Server 2003 Enterprise 64-bit Edition | 9.2 TS1M0 | |||
| Microsoft Windows XP 64-bit Edition | 9.2 TS1M0 | |||
| Microsoft® Windows® for x64 | 9.2 TS1M0 | |||
| Microsoft Windows Server 2003 Datacenter Edition | 9.2 TS1M0 | |||
| Microsoft Windows Server 2003 Enterprise Edition | 9.2 TS1M0 | |||
| Microsoft Windows Server 2003 Standard Edition | 9.2 TS1M0 | |||
| Microsoft Windows XP Professional | 9.2 TS1M0 | |||
| Windows Vista | 9.2 TS1M0 | |||
| 64-bit Enabled AIX | 9.2 TS1M0 | |||
| 64-bit Enabled HP-UX | 9.2 TS1M0 | |||
| 64-bit Enabled Solaris | 9.2 TS1M0 | |||
| HP-UX IPF | 9.2 TS1M0 | |||
| Linux | 9.2 TS1M0 | |||
| Linux for x64 | 9.2 TS1M0 | |||
| OpenVMS on HP Integrity | 9.2 TS1M0 | |||
| Solaris for x64 | 9.2 TS1M0 | |||