Sample 33009: Creating a Top N Report
 |  |  |  |  |  |
Businesses rely on reports like these every day. It begins with what seems like a simple question. For example:
- “Who are our top ten customers, measured by amount of sales?”
- “Who are the ten most effective sales associates in each region?”
- “Which are the five top-selling brands for each product family that we distribute?”
SAS offers many procedures that you can use to create reports like these. This example uses the following steps:
- Use the MEANS procedure to summarize data, either over the entire data set or across a grouping variable by using the CLASS statement.
- Use the SORT procedure to rank the summarized data, then use the DATA step to include only the top n values in the result set.
- Use the REPORT procedure to create an easy-to-read listing report.
- Use the GCHART procedure to create a simple bar chart that communicates the results in a visual way.
This example includes four SAS programs:
- TopNCategories.sas – creates a Top N report for a column, stratified across a category variable.
- TopNCategoryCount.sas – creates a variation of the first report that uses frequency count as the measure.
- TopNStraight.sas – creates a simple Top N report for one column that uses one measure (sum or average).
- TopNStraightCount.sas – creates a variation of the third report that uses frequency count as the measure.
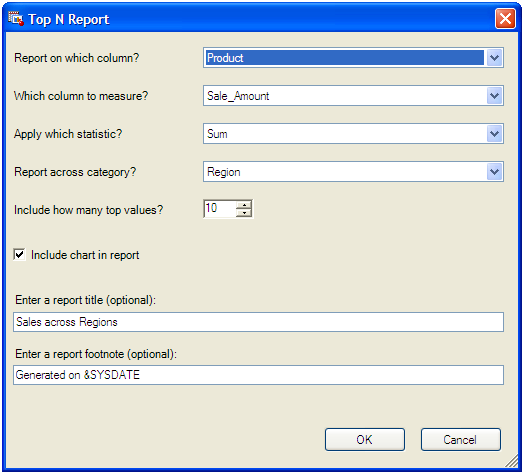
This example also includes a custom task that you can use with SAS Enterprise Guide 4.1 and SAS Add-In 2.1 for Microsoft Office. The custom task offers a user interface that makes it easy to generate all of these types of reports without having to modify any SAS programs. The custom task is in the Downloads section of this example.
This sample was written by Chris Hemedinger.
These sample files and code examples are provided by SAS Institute Inc. "as is" without warranty of any kind, either express or implied, including but not limited to the implied warranties of merchantability and fitness for a particular purpose. Recipients acknowledge and agree that SAS Institute shall not be liable for any damages whatsoever arising out of their use of this material. In addition, SAS Institute will provide no support for the materials contained herein.
/* Note: These samples refer to the sample */
/* SASHELP.CARS data that is supplied with */
/* SAS 9.2 */
/*************************************************/
/* TOPNCATEGORIES.SAS */
/* Top N report for data across categories */
/* Use macro variables to customize the data */
/* source. */
/* DATA - SAS library.member for input data */
/* REPORT - column to report on */
/* MEASURE - column to measure for the report */
/* MEASUREFORMAT - specify to preserve measure */
/* format in the report (currency, for example) */
/* STAT - SUM or MEAN */
/* N - The "N" in Top N - how many to show */
/* CATEGORY - across which category? */
/*************************************************/
%let data=SASHELP.CARS;
%let report=Model;
%let measure=MPG_City;
%let measureformat=%str(format=BEST6.);
%let stat=MEAN;
%let n=10;
%let category=Origin;
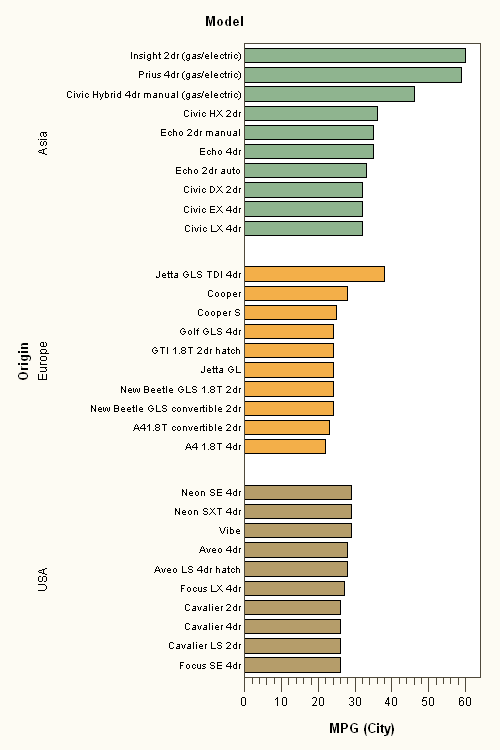
title "Top Models by MPG_City for each region of Origin";
footnote;
/* summarize the data across a category and store */
/* the output in an output data set */
proc means data=&data &stat noprint;
var &measure;
class &category &report;
output out=summary &stat=&measure &category /levels;
run;
/* store the value of the measure for ALL rows and */
/* the row count into a macro variable for use */
/* later in the report */
proc sql noprint;
select &measure,_FREQ_ into :overall,:numobs
from summary where _TYPE_=0;
select count(distinct &category) into :categorycount from summary;
quit;
/* sort the results so that we get the TOP values */
/* rising to the top of the data set */
proc sort data=work.summary out=work.topn;
where _type_>2;
by &category descending &measure;
run;
/* Pass through the data and output the first N */
/* values for each category */
data topn;
length rank 8;
label rank="Rank";
set topn;
by &category descending &measure;
if first.&category then rank=0;
rank+1;
if rank le &n then output;
run;
/* Create a report listing for the top values in each category */
footnote2 "&stat of &measure for ALL values of &report: &overall (&numobs total rows)";
proc report data=topn;
columns &category rank &report &measure;
define &category /order;
define rank /display;
define &measure / analysis &measureformat;
run;
quit;
/* Create a simple bar graph for the data to show the rankings */
/* and relative values */
/* Calculate size of chart based on number of category values */
goptions ypixels=%eval(250 * &categorycount) xpixels=500;
proc gchart data=topn
;
hbar &report /
sumvar=&measure
group=&category
descending
nozero
clipref
frame
discrete
type=&stat
patternid=group
;
run;
quit;
/*************************************************/
/* TOPNCATEGORYCOUNT.SAS */
/* N - The "N" in Top N - how many to show */
/* CATEGORY - across which category? */
/*************************************************/
%let data=SASHELP.CARS;
%let report=Make;
%let n=10;
%let category=Origin;
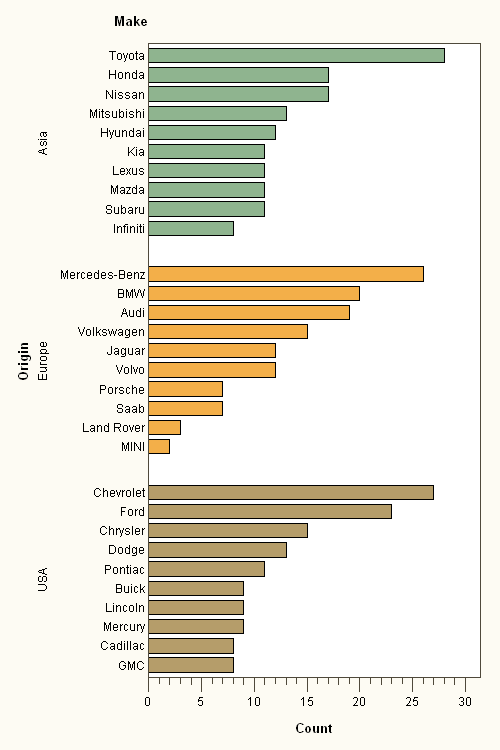
title "Automakers with the most Models, by Origin";
footnote;
data work._tpnview / view=work._tpnview;
set &data;
_tpncount=1;
label _tpncount='Count';
run;
/* do not change these for the Count report */
%let data=work._tpnview;
%let measure=_tpncount;
%let stat=SUM;
%let measureformat=;
/* summarize the data across a category and store */
/* the output in an output data set */
proc means data=&data &stat noprint;
var &measure;
class &category &report;
output out=summary &stat=&measure &category /levels;
run;
/* store the value of the measure for ALL rows and */
/* the row count into a macro variable for use */
/* later in the report */
proc sql noprint;
select &measure,_FREQ_ into :overall,:numobs
from summary where _TYPE_=0;
select count(distinct &category) into :categorycount from summary;
quit;
/* sort the results so that we get the TOP values */
/* rising to the top of the data set */
proc sort data=work.summary out=work.topn;
where _type_>2;
by &category descending &measure;
run;
/* Pass through the data and output the first N */
/* values for each category */
data topn;
length rank 8;
label rank="Rank";
set topn;
by &category descending &measure;
if first.&category then rank=0;
rank+1;
if rank le &n then output;
run;
/* Create a report listing for the top values in each category */
footnote2 "&report: Counted &overall values (&numobs total rows)";
proc report data=topn;
columns &category rank &report &measure;
define &category /order;
define rank /display;
define &measure / analysis &measureformat;
run;
quit;
/* Create a simple bar graph for the data to show the rankings */
/* and relative values */
goptions ypixels=%eval(250 * &categorycount) xpixels=500;
proc gchart data=topn
;
hbar &report /
sumvar=&measure
group=&category
descending
nozero
clipref
frame
discrete
type=&stat
patternid=group
;
run;
quit;
/*************************************************/
/* TOPNSTRAIGHT.SAS */
/* Top N report for entire data set */
/* Use macro variables to customize the data */
/* source. */
/* DATA - SAS library.member for input data */
/* REPORT - column to report on */
/* MEASURE - column to measure for the report */
/* MEASUREFORMAT - specify to preserve measure */
/* format in the report (currency, for example) */
/* STAT - SUM or MEAN */
/* N - The "N" in Top N - how many to show */
/*************************************************/
%let data=SASHELP.CARS;
%let report=MODEL;
%let measure=INVOICE;
%let measureformat=%str(format=DOLLAR12.2);
%let stat=SUM;
%let n=10;
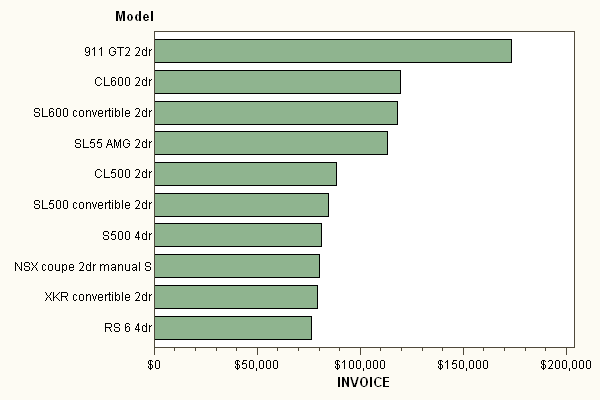
title "Top Models by Invoice price";
footnote;
/* summarize the data and store */
/* the output in an output data set */
proc means data=&data &stat noprint;
var &measure;
class &report;
output out=summary &stat=&measure /levels;
run;
/* store the value of the measure for ALL rows and */
/* the row count into a macro variable for use */
/* later in the report */
proc sql noprint;
select &measure,_FREQ_ into :overall,:numobs
from summary where _TYPE_=0;
quit;
/* sort the results so that we get the TOP values */
/* rising to the top of the data set */
proc sort data=work.summary out=work.topn;
where _type_>0;
by descending &measure;
run;
/* Pass through the data and output the first N */
/* values */
data topn;
length rank 8;
label rank="Rank";
set topn;
by descending &measure;
rank+1;
if rank le &n then output;
run;
/* Create a report listing for the top values */
footnote2 "&stat of &measure for ALL values of &report: &overall (&numobs total rows)";
proc report data=topn;
columns rank &report &measure;
define rank /display;
define &measure / analysis &measureformat;
run;
quit;
/* Create a simple bar graph for the data to show the rankings */
/* and relative values */
goptions xpixels=600 ypixels=400;
proc gchart data=topn
;
hbar &report /
sumvar=&measure
descending
nozero
clipref
frame
discrete
type=&stat
;
run;
quit;
/*************************************************/
/* TOPNSTRAIGHTCOUNT.SAS */
/* Top N report variation - Count is the measure */
/* Use macro variables to customize the data */
/* source. */
/* DATA - SAS library.member for input data */
/* REPORT - column to report on */
/* N - The "N" in Top N - how many to show */
/*************************************************/
%let data=SASHELP.CARS;
%let report=MAKE;
%let n=10;
data work._tpnview / view=work._tpnview;
set &data;
_tpncount=1;
label _tpncount='Count';
run;
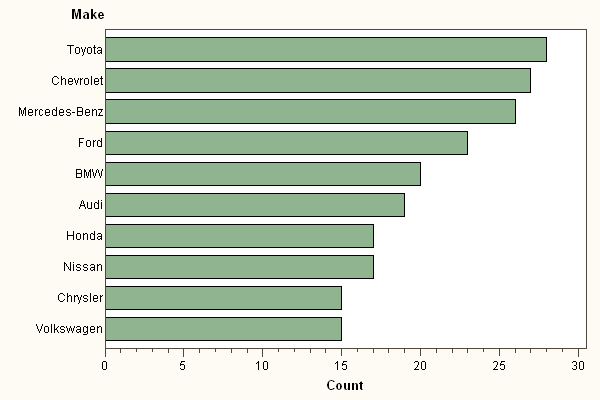
title "Automakers with the most Models";
footnote;
/* do not change these for the Count report */
%let data=work._tpnview;
%let measure=_tpncount;
%let stat=SUM;
%let measureformat=;
/* summarize the data and store */
/* the output in an output data set */
proc means data=&data &stat noprint;
var &measure;
class &report;
output out=summary &stat=&measure /levels;
run;
/* store the value of the measure for ALL rows and */
/* the row count into a macro variable for use */
/* later in the report */
proc sql noprint;
select &measure,_FREQ_ into :overall,:numobs
from summary where _TYPE_=0;
quit;
/* sort the results so that we get the TOP values */
/* rising to the top of the data set */
proc sort data=work.summary out=work.topn;
where _type_>0;
by descending &measure;
run;
/* Pass through the data and output the first N */
/* values */
data topn;
length rank 8;
label rank="Rank";
set topn;
by descending &measure;
rank+1;
if rank le &n then output;
run;
/* Create a report listing for the top values */
footnote2 "&report: Counted &overall values (&numobs total rows)";
proc report data=topn;
columns rank &report &measure;
define rank /display;
define &measure / analysis &measureformat;
run;
quit;
/* Create a simple bar graph for the data to show the rankings */
/* and relative values */
goptions xpixels=600 ypixels=400;
proc gchart data=topn
;
hbar &report /
sumvar=&measure
descending
nozero
clipref
frame
discrete
type=&stat
;
run;
quit;
These sample files and code examples are provided by SAS Institute Inc. "as is" without warranty of any kind, either express or implied, including but not limited to the implied warranties of merchantability and fitness for a particular purpose. Recipients acknowledge and agree that SAS Institute shall not be liable for any damages whatsoever arising out of their use of this material. In addition, SAS Institute will provide no support for the materials contained herein.
| Top Models by MPG_City for each region of Origin |
| Origin | Rank | Model | MPG (City) |
|---|---|---|---|
| Asia | 1 | Insight 2dr (gas/electric) | 60 |
| 2 | Prius 4dr (gas/electric) | 59 | |
| 3 | Civic Hybrid 4dr manual (gas/electric) | 46 | |
| 4 | Civic HX 2dr | 36 | |
| 5 | Echo 2dr manual | 35 | |
| 6 | Echo 4dr | 35 | |
| 7 | Echo 2dr auto | 33 | |
| 8 | Civic DX 2dr | 32 | |
| 9 | Civic EX 4dr | 32 | |
| 10 | Civic LX 4dr | 32 | |
| Europe | 1 | Jetta GLS TDI 4dr | 38 |
| 2 | Cooper | 28 | |
| 3 | Cooper S | 25 | |
| 4 | GTI 1.8T 2dr hatch | 24 | |
| 5 | Golf GLS 4dr | 24 | |
| 6 | Jetta GL | 24 | |
| 7 | New Beetle GLS 1.8T 2dr | 24 | |
| 8 | New Beetle GLS convertible 2dr | 24 | |
| 9 | A41.8T convertible 2dr | 23 | |
| 10 | A4 1.8T 4dr | 22 | |
| USA | 1 | Neon SE 4dr | 29 |
| 2 | Neon SXT 4dr | 29 | |
| 3 | Vibe | 29 | |
| 4 | Aveo 4dr | 28 | |
| 5 | Aveo LS 4dr hatch | 28 | |
| 6 | Focus LX 4dr | 27 | |
| 7 | Cavalier 2dr | 26 | |
| 8 | Cavalier 4dr | 26 | |
| 9 | Cavalier LS 2dr | 26 | |
| 10 | Focus SE 4dr | 26 |
| MEAN of MPG_City for ALL values of Model: 20.06075 ( 428 total rows) |
| Top Models by MPG_City for each region of Origin |
| MEAN of MPG_City for ALL values of Model: 20.06075 ( 428 total rows) |
| Automakers with the most Models, by Origin |
| Origin | Rank | Make | Count |
|---|---|---|---|
| Asia | 1 | Toyota | 28 |
| 2 | Honda | 17 | |
| 3 | Nissan | 17 | |
| 4 | Mitsubishi | 13 | |
| 5 | Hyundai | 12 | |
| 6 | Kia | 11 | |
| 7 | Lexus | 11 | |
| 8 | Mazda | 11 | |
| 9 | Subaru | 11 | |
| 10 | Infiniti | 8 | |
| Europe | 1 | Mercedes-Benz | 26 |
| 2 | BMW | 20 | |
| 3 | Audi | 19 | |
| 4 | Volkswagen | 15 | |
| 5 | Jaguar | 12 | |
| 6 | Volvo | 12 | |
| 7 | Porsche | 7 | |
| 8 | Saab | 7 | |
| 9 | Land Rover | 3 | |
| 10 | MINI | 2 | |
| USA | 1 | Chevrolet | 27 |
| 2 | Ford | 23 | |
| 3 | Chrysler | 15 | |
| 4 | Dodge | 13 | |
| 5 | Pontiac | 11 | |
| 6 | Buick | 9 | |
| 7 | Lincoln | 9 | |
| 8 | Mercury | 9 | |
| 9 | Cadillac | 8 | |
| 10 | GMC | 8 |
| Make: Counted 428 values ( 428 total rows) |
| Top Models by Invoice price |
| Rank | Model | INVOICE |
|---|---|---|
| 1 | 911 GT2 2dr | $173,560.00 |
| 2 | CL600 2dr | $119,600.00 |
| 3 | SL600 convertible 2dr | $117,854.00 |
| 4 | SL55 AMG 2dr | $113,388.00 |
| 5 | CL500 2dr | $88,324.00 |
| 6 | SL500 convertible 2dr | $84,325.00 |
| 7 | S500 4dr | $80,939.00 |
| 8 | NSX coupe 2dr manual S | $79,978.00 |
| 9 | XKR convertible 2dr | $79,226.00 |
| 10 | RS 6 4dr | $76,417.00 |
| SUM of INVOICE for ALL values of MODEL: 12846292 ( 428 total rows) |
Using the options on the task user interface, you can create all of the types of reports that are included in this example. Here is a screen shot of the task form:
To install and use the task:
- Download a copy of TopNTask.zip to a folder on your machine.
- Extract SASPress.CustomTask.TopN.dll and place it in:
- C:\Program Files\SAS\Shared Files\BIClientTasks\Custom
- You might need to create the "Custom" subfolder.
- Start SAS Enterprise Guide. The task should appear in the Add-In menu.
The zip file archive contains a README.TXT file with more detailed instructions, if needed.
| Type: | Sample |
| Date Modified: | 2008-08-26 11:33:34 |
| Date Created: | 2008-08-19 13:24:09 |
Operating System and Release Information
| Product Family | Product | Host | Product Release | SAS Release | ||
| Starting | Ending | Starting | Ending | |||
| SAS System | SAS Enterprise Guide | Microsoft Windows XP Professional | 4.1 | 4.1 | 9.1 TS1M3 | 9.2 TS1M0 |
| Microsoft Windows Server 2003 Standard Edition | 4.1 | 4.1 | 9.1 TS1M3 | 9.2 TS1M0 | ||
| Microsoft Windows Server 2003 Enterprise Edition | 4.1 | 4.1 | 9.1 TS1M3 | 9.2 TS1M0 | ||
| Microsoft Windows Server 2003 Datacenter Edition | 4.1 | 4.1 | 9.1 TS1M3 | 9.2 TS1M0 | ||
| Microsoft Windows NT Workstation | 4.1 | 9.1 TS1M3 | ||||
| Microsoft Windows 2000 Professional | 4.1 | 9.1 TS1M3 | ||||
| Microsoft Windows 2000 Server | 4.1 | 9.1 TS1M3 | ||||
| Microsoft Windows 2000 Datacenter Server | 4.1 | 9.1 TS1M3 | ||||
| Microsoft Windows 2000 Advanced Server | 4.1 | 9.1 TS1M3 | ||||
| Microsoft® Windows® for x64 | 4.1 | 4.1 | 9.1 TS1M3 | 9.2 TS1M0 | ||
| Windows Vista | 4.1 | 4.1 | 9.1 TS1M3 | 9.2 TS1M0 | ||