Sample 26174: Using SAS® Web Report Studio to pass prompt values between linked reports
 |  |  |
Overview
SAS Web Report Studio enables you to link reports together. When you link reports, you have the option to associate data item values in the source report with prompts in the target report. In this way, the prompt window is bypassed for the target report, and the target report is automatically subset based on the values in the source report. This sample shows you how to link a graph and a crosstabulation table to another report. As the input table for both the source report (Shoe Sales Main) and the target report (Shoe Sales Detail), this sample uses the SHOES table, which is one of the sample tables included with SAS.
Note: This sample shows you how to link two relational reports. For an example of linking from an OLAP-based report to a relational report, see Sample 40009.
About the Two Reports
The Shoe Sales Main Report contains a multi-line graph and a crosstabulation table.
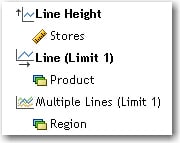
The multi-line graph has these data assignments:
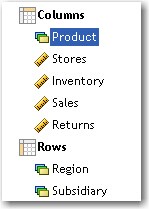
The crosstabulation table has these assignments:
The Shoe Sales Detail Report contains prompts for Product and Region and displays results in a crosstabulation table.
Link the Line Graph to the Shoe Detail Report
Note: Before you can create the link, the target report must exist.
- Open the Shoe Sales Main Report in Edit mode.
- To select the Report Linking option, either right-click on the line graph (version 4.2 and later) or use the line graph toolbar (version 3.1).
Note: Beginning with SAS Web Report Studio 4.2, you must have the capability to link reports. If you do not see the menu option, contact your system administrator.
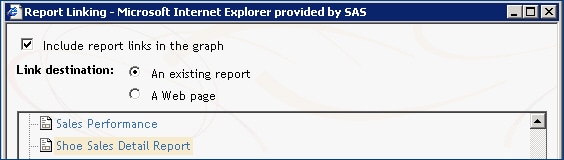
- In the Report Linking dialog box, select the Shoe Sales Detail Report.
- As a best practice, also enter a tooltip.
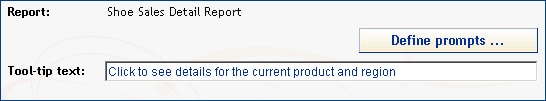
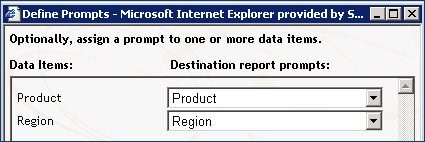
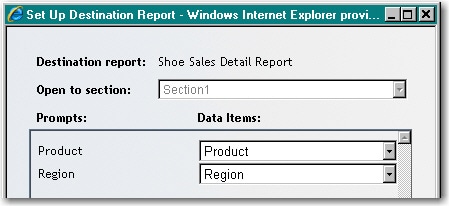
- To associate the Product and Region data items in the Shoe Sales Main Report with the Product and Region prompts in Shoe Sales Detail Report, click the Set Up Destination Report button (version 4.2 and later) or click Define Prompts (version 3.1).
Note: In version 3.1, the data items are on the left and the prompts are on the right. This order is reversed beginning with version 4.2. In addition, if the target report has multiple sections, you can select the first section to display.
|
Version 3.1 |
Version 4.2 and later |
Note: If you are using the second maintenance release for SAS 9.2 (TS2M2), then you can associate hidden data items (OLAP only) and group breaks with prompts in the target report. If you are using version 4.3, then you can also associate hidden data items in relational reports.
Link the Crosstabulation Table to the Shoe Detail Report
- Open the Shoe Sales Main Report in Edit mode.
- To select the Report Linking option, either right-click on the table (version 4.2 and later) or use the table toolbar (version 3.1).
Note: Beginning with SAS Web Report Studio 4.2, you must have the capability to link reports. If you do not see the menu option, contact your system administrator.
- In the Report Linking dialog box, select the Shoe Sales Detail Report.
- Enter a tooltip.
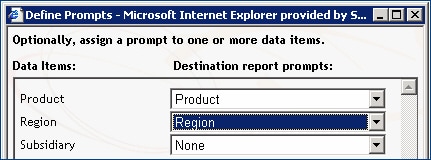
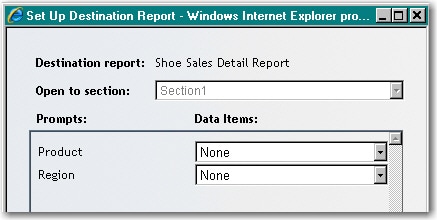
- To associate the Product and Region data items in the Shoe Sales Main Report with the Product and Region prompts in Shoe Sales Detail Report, click the Set Up Destination Report button (version 4.2 and later) or click Define Prompts (version 3.1).
There is no Subsidiary prompt in the Shoe Sales Detail Report. So, do not select a prompt to associate with the Subsidiary data item.
Note: In version 3.1, the data items are on the left and the prompts are on the right. This order is reversed beginning with version 4.2. In addition, if the target report has multiple sections, you can select the first section to display.
|
Version 3.1 |
Version 4.2 and later |
View the Shoe Sales Main Report
- View the report.
- In the line graph, place your mouse pointer over a line point. Notice that the pop-up box displays the tooltip message that was entered for the link.
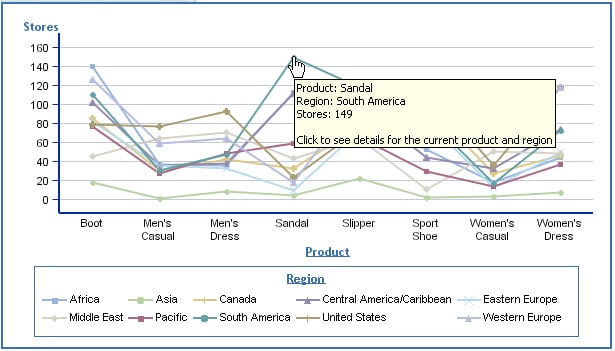
- Click the point in order to send the values associated with that point ("Sandal" and "South America") to the Product and Region prompts for the Shoe Sales Detail Report.
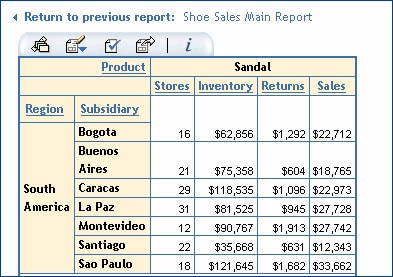
- Click Return to previous report.
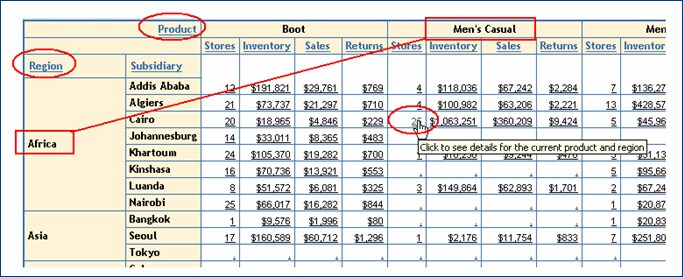
- Place your mouse pointer over a value in the table. In this case, only the tooltip message is displayed.
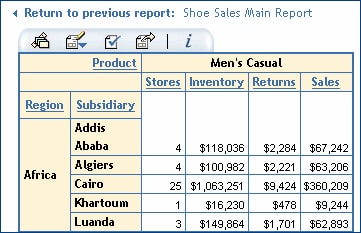
- Click on the value. In this sample, "Men's Casual" and "Africa" are sent to the prompts for Product and Region in the Shoe Sales Detail Report.
Notes on report linking via prompts
- The target report must use relational data.
- From a crosstabulation table in a source report, you cannot pass numeric values, date values, or unformatted character values to a character prompt in a target report. In addition, formatted character values must be valid values for the prompt in the target report; otherwise, no results are returned. For more information, see SAS Note 45476.
- For information about passing hidden values (including group breaks) from a source report to a target report, see SAS Note 35642.
- For details about how prompt values are passed from multidimensional crosstabulation tables, see SAS Note 36631 .
- If you define a link to a report that is manually refreshed, the prompt values sent from the source report are not used for the target report. Instead, SAS Web Report Studio displays the results of the last query run for the target report.
Additional Documentation
For more information about SAS Web Report Studio, see the SAS Web Report Studio documentation page.
For more information about SAS Information Map Studio, see the SAS Information Map Studio documentation page.
SAS Global Forum 2008 Paper 064-2008: SAS Web Report Studio Tips and Techniques
These sample files and code examples are provided by SAS Institute Inc. "as is" without warranty of any kind, either express or implied, including but not limited to the implied warranties of merchantability and fitness for a particular purpose. Recipients acknowledge and agree that SAS Institute shall not be liable for any damages whatsoever arising out of their use of this material. In addition, SAS Institute will provide no support for the materials contained herein.
These sample files and code examples are provided by SAS Institute Inc. "as is" without warranty of any kind, either express or implied, including but not limited to the implied warranties of merchantability and fitness for a particular purpose. Recipients acknowledge and agree that SAS Institute shall not be liable for any damages whatsoever arising out of their use of this material. In addition, SAS Institute will provide no support for the materials contained herein.
| Type: | Sample |
| Topic: | Query and Reporting ==> Interactive Querying Query and Reporting Data Management ==> Data Sources ==> Information map |
| Date Modified: | 2008-04-14 16:47:15 |
| Date Created: | 2007-07-11 13:43:21 |
Operating System and Release Information
| Product Family | Product | Host | Product Release | SAS Release | ||
| Starting | Ending | Starting | Ending | |||
| SAS System | SAS Web Report Studio | Microsoft® Windows® for x64 | 3.1 | 9.1 TS1M3 SP4 | ||
| Microsoft Windows 2000 Advanced Server | 3.1 | 9.1 TS1M3 SP4 | ||||
| Microsoft Windows 2000 Datacenter Server | 3.1 | 9.1 TS1M3 SP4 | ||||
| Microsoft Windows 2000 Server | 3.1 | 9.1 TS1M3 SP4 | ||||
| Microsoft Windows 2000 Professional | 3.1 | 9.1 TS1M3 SP4 | ||||
| Microsoft Windows NT Workstation | 3.1 | 9.1 TS1M3 SP4 | ||||
| Microsoft Windows Server 2003 Datacenter Edition | 3.1 | 9.1 TS1M3 SP4 | ||||
| Microsoft Windows Server 2003 Enterprise Edition | 3.1 | 9.1 TS1M3 SP4 | ||||
| Microsoft Windows Server 2003 Standard Edition | 3.1 | 9.1 TS1M3 SP4 | ||||
| Microsoft Windows XP Professional | 3.1 | 9.1 TS1M3 SP4 | ||||
| 64-bit Enabled AIX | 3.1 | 9.1 TS1M3 SP4 | ||||
| 64-bit Enabled Solaris | 3.1 | 9.1 TS1M3 SP4 | ||||
| HP-UX IPF | 3.1 | 9.1 TS1M3 SP4 | ||||