Sample 25595: Creating and modifying box plots using the SYMBOL statement with PROC GPLOT
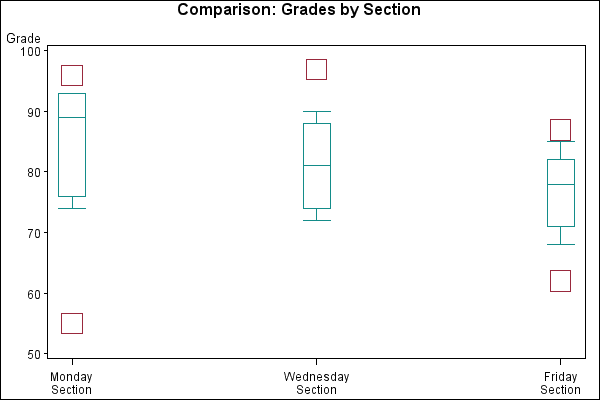
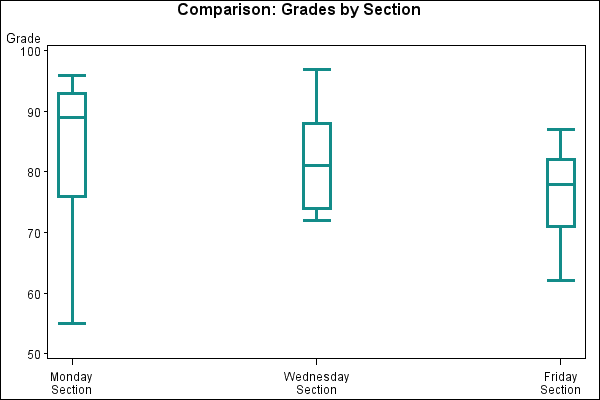
This example shows how to create box plots and how to specify SYMBOL definitions so data outside the box plot range can be represented with data points. It also shows how to change a box plot's percentile range to see if the new range encompasses the data.
These sample files and code examples are provided by SAS Institute
Inc. "as is" without warranty of any kind, either express or implied, including
but not limited to the implied warranties of merchantability and fitness for a
particular purpose. Recipients acknowledge and agree that SAS Institute shall
not be liable for any damages whatsoever arising out of their use of this material.
In addition, SAS Institute will provide no support for the materials contained herein.
This sample code shows how to create box plots and how to specify SYMBOL definitions so data outside the box plot range can be represented with data points. It also shows how to change a box plot's percentile range to see if the new range encompasses the data.
The graphics output in the Results tab was produced using SAS® 9.2. Submitting the sample code with releases of SAS prior to SAS 9.2 might produce different results.
 /* Set the graphics environment */
goptions reset=all border cback=white htitle=12pt;

 /* Create the data set GRADES */
data grades;
   input Section $ Grade @@;
   datalines;
A 74 A 89 A 91 A 76 A 87 A 93 A 93 A 96 A 55
B 72 B 72 B 84 B 81 B 97 B 78 B 88 B 90 B 74
C 62 C 74 C 71 C 87 C 68 C 78 C 80 C 85 C 82
;
run;

 /* Add a title to the graph */
title1 'Comparison: Grades by Section';

 /* Define symbol characteristics */
symbol interpol=boxt20 /* box plot              */
       co=vibg         /* box and whisker color */
       bwidth=6        /* box width             */
       value=square    /* plot symbol           */
       cv=depk         /* plot symbol color     */
       height=4;       /* symbol height         */

 /* Define axis characteristics */
axis1 label=none
      value=(t=1 'Monday' j=c 'Section'
             t=2 'Wednesday' j=c 'Section'
             t=3 'Friday' j=c 'Section')
      offset=(5,5);
axis2 minor=none order=(50 to 100 by 10);

 /* Create the graph */
proc gplot data= grades;
   plot grade*section / haxis=axis1
                        vaxis=axis2;
run;

 /* Define the symbol statement for second plot */
symbol1 interpol=boxt10 width=2;

   plot grade*section / haxis=axis1
                        vaxis=axis2;
run;
quit;
These sample files and code examples are provided by SAS Institute
Inc. "as is" without warranty of any kind, either express or implied, including
but not limited to the implied warranties of merchantability and fitness for a
particular purpose. Recipients acknowledge and agree that SAS Institute shall
not be liable for any damages whatsoever arising out of their use of this material.
In addition, SAS Institute will provide no support for the materials contained herein.
This example shows how to create box plots and how to specify SYMBOL definitions so data outside the box plot range can be represented with data points. It also shows how to change a box plot's percentile range to see if the new range encompasses the data.
| Type: | Sample |
| Topic: | Query and Reporting ==> Creating Reports ==> Graphical ==> Graph Types ==> Plots ==> Other Plots
SAS Reference ==> Procedures ==> GPLOT
Query and Reporting ==> Creating Reports ==> Graphical ==> Graph Elements ==> Symbols/Interpolation
|
| Date Modified: | 2005-09-22 03:03:13 |
| Date Created: | 2005-05-23 14:17:51 |
Operating System and Release Information
| SAS System | SAS/GRAPH | z/OS | 9.1 TS1M0 | |
| Microsoft® Windows® for 64-Bit Itanium-based Systems | 9.1 TS1M0 | |
| Microsoft Windows Server 2003 Datacenter 64-bit Edition | 9.1 TS1M0 | |
| Microsoft Windows Server 2003 Enterprise 64-bit Edition | 9.1 TS1M0 | |
| Microsoft Windows 2000 Advanced Server | 9.1 TS1M0 | |
| Microsoft Windows 2000 Datacenter Server | 9.1 TS1M0 | |
| Microsoft Windows 2000 Server | 9.1 TS1M0 | |
| Microsoft Windows 2000 Professional | 9.1 TS1M0 | |
| Microsoft Windows NT Workstation | 9.1 TS1M0 | |
| Microsoft Windows Server 2003 Datacenter Edition | 9.1 TS1M0 | |
| Microsoft Windows Server 2003 Enterprise Edition | 9.1 TS1M0 | |
| Microsoft Windows Server 2003 Standard Edition | 9.1 TS1M0 | |
| Microsoft Windows XP Professional | 9.1 TS1M0 | |
| 64-bit Enabled AIX | 9.1 TS1M0 | |
| 64-bit Enabled HP-UX | 9.1 TS1M0 | |
| 64-bit Enabled Solaris | 9.1 TS1M0 | |
| HP-UX IPF | 9.1 TS1M0 | |
| Linux | 9.1 TS1M0 | |
| OpenVMS Alpha | 9.1 TS1M0 | |
| Tru64 UNIX | 9.1 TS1M0 | |


