Sample 25526: Use patterns and joins in contour plots with PROC GCONTOUR
This sample demonstrates the differences between using lines and patterns to represent contour levels with PROC GCONTOUR.
These sample files and code examples are provided by SAS Institute
Inc. "as is" without warranty of any kind, either express or implied, including
but not limited to the implied warranties of merchantability and fitness for a
particular purpose. Recipients acknowledge and agree that SAS Institute shall
not be liable for any damages whatsoever arising out of their use of this material.
In addition, SAS Institute will provide no support for the materials contained herein.
This sample demonstrates the differences between using lines and patterns to represent contour levels with PROC GCONTOUR.
The graphics output in the Results tab was produced using SAS 9.2. Submitting the sample code with a release of SAS prior to 9.2 might produce different results.
/* Set the graphics environment */
goptions reset=all border cback=white
htitle=12pt;
/* Create data set WORK.SWIRL */
data swirl;
do x=-5 to 5 by 0.25;
do y=-5 to 5 by 0.25;
if x+y=0 then z=0;
else z=(x*y)*((x*x-y*y)/(x*x+y*y));
output;
end;
end;
run;
/* Define the title for the first plot */
title1 'Simple Contour Plot';
/* Produce the contour plot */
proc gcontour data=swirl;
plot y*x=z;
run;
quit;
/* Redefine the title for the second plot */
title1 'Representing Contour Levels with Patterns';
/* Produce the contour plot */
proc gcontour data=swirl;
plot y*x=z / pattern
coutline=gray;
run;
quit;
/* Redefine the title for the third plot */
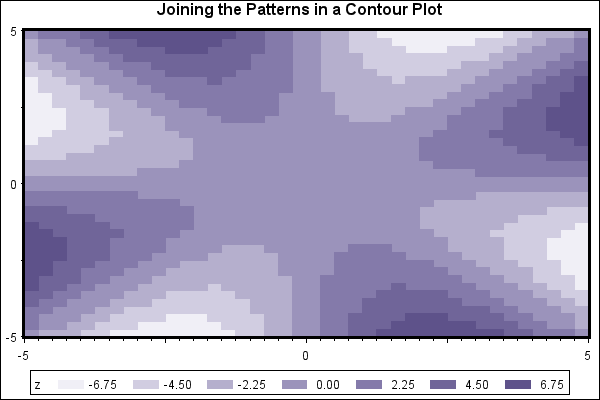
title1 'Joining the Patterns in a Contour Plot';
/* Define axis and legend characteristics */
axis1 label=none value=('-5' ' ' '0' ' ' '5')
width=2;
axis2 label=none value=('-5' ' ' '0' ' ' '5')
width=2;
legend frame;
/* Produce the contour plot */
proc gcontour data=swirl;
plot y*x=z / pattern
join
haxis=axis1
vaxis=axis2
legend=legend1;
run;
quit;
These sample files and code examples are provided by SAS Institute
Inc. "as is" without warranty of any kind, either express or implied, including
but not limited to the implied warranties of merchantability and fitness for a
particular purpose. Recipients acknowledge and agree that SAS Institute shall
not be liable for any damages whatsoever arising out of their use of this material.
In addition, SAS Institute will provide no support for the materials contained herein.
This example demonstrates the differences between using lines and patterns to represent contour levels.
| Type: | Sample |
| Topic: | SAS Reference ==> Procedures ==> GCONTOUR
|
| Date Modified: | 2005-08-27 03:03:19 |
| Date Created: | 2005-05-23 14:13:18 |
Operating System and Release Information
| SAS System | SAS/GRAPH | z/OS | 9.1 TS1M0 | |
| Microsoft® Windows® for 64-Bit Itanium-based Systems | 9.1 TS1M0 | |
| Microsoft Windows Server 2003 Datacenter 64-bit Edition | 9.1 TS1M0 | |
| Microsoft Windows Server 2003 Enterprise 64-bit Edition | 9.1 TS1M0 | |
| Microsoft Windows 2000 Advanced Server | 9.1 TS1M0 | |
| Microsoft Windows 2000 Datacenter Server | 9.1 TS1M0 | |
| Microsoft Windows 2000 Server | 9.1 TS1M0 | |
| Microsoft Windows 2000 Professional | 9.1 TS1M0 | |
| Microsoft Windows NT Workstation | 9.1 TS1M0 | |
| Microsoft Windows Server 2003 Datacenter Edition | 9.1 TS1M0 | |
| Microsoft Windows Server 2003 Enterprise Edition | 9.1 TS1M0 | |
| Microsoft Windows Server 2003 Standard Edition | 9.1 TS1M0 | |
| Microsoft Windows XP Professional | 9.1 TS1M0 | |
| 64-bit Enabled AIX | 9.1 TS1M0 | |
| 64-bit Enabled HP-UX | 9.1 TS1M0 | |
| 64-bit Enabled Solaris | 9.1 TS1M0 | |
| HP-UX IPF | 9.1 TS1M0 | |
| Linux | 9.1 TS1M0 | |
| OpenVMS Alpha | 9.1 TS1M0 | |
| Tru64 UNIX | 9.1 TS1M0 | |