Sample 25518: Order and label pie chart slices using PROC GCHART
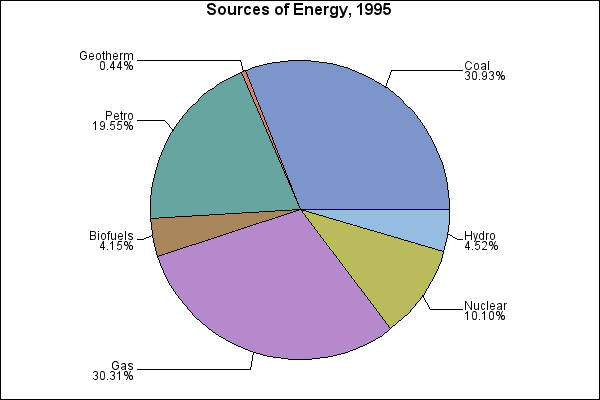
This example labels pie chart slices in the order in which they are specified by the MIDPOINTS= option on the PIE statement. Options are also specified to control where the pie values are displayed.
These sample files and code examples are provided by SAS Institute
Inc. "as is" without warranty of any kind, either express or implied, including
but not limited to the implied warranties of merchantability and fitness for a
particular purpose. Recipients acknowledge and agree that SAS Institute shall
not be liable for any damages whatsoever arising out of their use of this material.
In addition, SAS Institute will provide no support for the materials contained herein.
This example labels pie chart slices in the order they are specified by the MIDPOINTS= option on the PIE statement. Options are also specified to control where the pie values are displayed.
The graphics output in the Results tab was produced using SAS® 9.2. Submitting the sample code with releases of SAS prior to SAS 9.2 might produce different results.
 /* Set the graphics environment */
goptions reset=all border cback=white htitle=12pt;

 /* Create data set ENPROD */
data enprod;
   input @1  year 4. @6 engytype $8. @16 produced 5.2;
   datalines;
1985 Coal      19.33
1985 Gas       19.22
1985 Petro     18.99
1985 Nuclear    4.15
1985 Hydro      2.97
1985 Geotherm    .20
1985 Biofuels    .01
1995 Coal      21.98
1995 Gas       21.54
1995 Petro     13.89
1995 Nuclear    7.18
1995 Hydro      3.21
1995 Geotherm    .31
1995 Biofuels   2.95
;
run;

 /* Define the title for the chart */
title 'Sources of Energy, 1995';

 /* Generate pie chart */
proc gchart data=enprod (where=(year=1995));
   pie engytype / sumvar=produced
                  other=0
                  midpoints='Coal' 'Geotherm' 'Petro'
                            'Biofuels' 'Gas' 'Nuclear' 'Hydro'
                  value=none
                  percent=arrow
                  slice=arrow
                  noheading;
run;
quit;
These sample files and code examples are provided by SAS Institute
Inc. "as is" without warranty of any kind, either express or implied, including
but not limited to the implied warranties of merchantability and fitness for a
particular purpose. Recipients acknowledge and agree that SAS Institute shall
not be liable for any damages whatsoever arising out of their use of this material.
In addition, SAS Institute will provide no support for the materials contained herein.
This example labels pie chart slices in the order they are specified by the MIDPOINTS= option on the PIE statement. Options are also specified to control where the pie values are displayed.
| Type: | Sample |
| Topic: | Query and Reporting ==> Creating Reports ==> Graphical ==> Graph Types ==> Charts ==> Pie
SAS Reference ==> Procedures ==> GCHART
|
| Date Modified: | 2005-08-24 16:06:36 |
| Date Created: | 2005-05-23 14:12:47 |
Operating System and Release Information
| SAS System | SAS/GRAPH | z/OS | 9.1 TS1M0 | |
| Microsoft® Windows® for 64-Bit Itanium-based Systems | 9.1 TS1M0 | |
| Microsoft Windows Server 2003 Datacenter 64-bit Edition | 9.1 TS1M0 | |
| Microsoft Windows Server 2003 Enterprise 64-bit Edition | 9.1 TS1M0 | |
| Microsoft Windows 2000 Advanced Server | 9.1 TS1M0 | |
| Microsoft Windows 2000 Datacenter Server | 9.1 TS1M0 | |
| Microsoft Windows 2000 Server | 9.1 TS1M0 | |
| Microsoft Windows 2000 Professional | 9.1 TS1M0 | |
| Microsoft Windows NT Workstation | 9.1 TS1M0 | |
| Microsoft Windows Server 2003 Datacenter Edition | 9.1 TS1M0 | |
| Microsoft Windows Server 2003 Enterprise Edition | 9.1 TS1M0 | |
| Microsoft Windows Server 2003 Standard Edition | 9.1 TS1M0 | |
| Microsoft Windows XP Professional | 9.1 TS1M0 | |
| 64-bit Enabled AIX | 9.1 TS1M0 | |
| 64-bit Enabled HP-UX | 9.1 TS1M0 | |
| 64-bit Enabled Solaris | 9.1 TS1M0 | |
| HP-UX IPF | 9.1 TS1M0 | |
| Linux | 9.1 TS1M0 | |
| OpenVMS Alpha | 9.1 TS1M0 | |
| Tru64 UNIX | 9.1 TS1M0 | |


