Sample 25254: Animated pie chart
These sample files and code examples are provided by SAS Institute
Inc. "as is" without warranty of any kind, either express or implied, including
but not limited to the implied warranties of merchantability and fitness for a
particular purpose. Recipients acknowledge and agree that SAS Institute shall
not be liable for any damages whatsoever arising out of their use of this material.
In addition, SAS Institute will provide no support for the materials contained herein.
/* There is a filename statement in the code below that     */
/* must be changed in order for you to successfully run     */
/* this code.                                               */
/* These statements set up a filename for the gif animation */
/* file you are about to create and set the appropriate     */
/* goptions for creating the file. You will need to change  */
/* your filename statement to point to an appropriate       */
/* location.                                                */

filename anim 'your_filename.gif';

goptions reset      = all
         device     = gifanim
         gsfname    = anim
         gsfmode    = replace
         delay      = 100
         iterations = 1
         disposal   = none
         hsize      = 8
         vsize      = 6
         cback      = white
         ftext      = swissb
         htext      = .8
         hpos       = 80
         vpos       = 32;

/*  This data step creates the data for the pie chart. */

data pie;
   length Class $ 8 Characteristic $ 32;
   input class Characteristic & Percent;
   datalines;
Lower Security  10
Lower High income  20
Lower Chance for advancement  15
Lower Meaningful work  58
Working Short hours  2
Working Security  10
Working High income  29
Working Chance for advancement  18
Working Meaningful work  44
Middle Short hours  3
Middle Security  7
Middle High income  23
Middle Chance for advancement  24
Middle Meaningful work  53
Upper Chance for advancement  10
Upper High income  15
Upper Meaningful work  75
;

/* The following code sets the pattern statements for the */
/* pie charts and uses a proc gchart to produce a series  */
/* of pie charts that will be animated by the GIFANIM     */
/* driver.                                                */

title;

pattern1 v=s c=cx405088;
pattern2 v=s c=cx885040;
pattern3 v=s c=cx8080BB;
pattern4 v=s c=cxE0D0A0;
pattern5 v=s c=cx401010;

proc gchart data=pie;

   pie Characteristic / ascending freq=Percent type=percent
                        noheading
                        invisible= 'Short hours' 'Security' 'High income'
                                   'Chance for advancement';
   pie Characteristic / ascending freq=Percent type=percent
                        noheading
                        invisible= 'Short hours' 'Security'
                                   'Chance for advancement';
   pie Characteristic / ascending freq=Percent type=percent
                        noheading
                        invisible= 'Short hours' 'Security';
   pie Characteristic / ascending freq=Percent type=percent
                        noheading
                        invisible= 'Short hours';
   pie Characteristic / ascending freq=Percent type=percent noheading; run; quit;

filename anim clear;
These sample files and code examples are provided by SAS Institute
Inc. "as is" without warranty of any kind, either express or implied, including
but not limited to the implied warranties of merchantability and fitness for a
particular purpose. Recipients acknowledge and agree that SAS Institute shall
not be liable for any damages whatsoever arising out of their use of this material.
In addition, SAS Institute will provide no support for the materials contained herein.
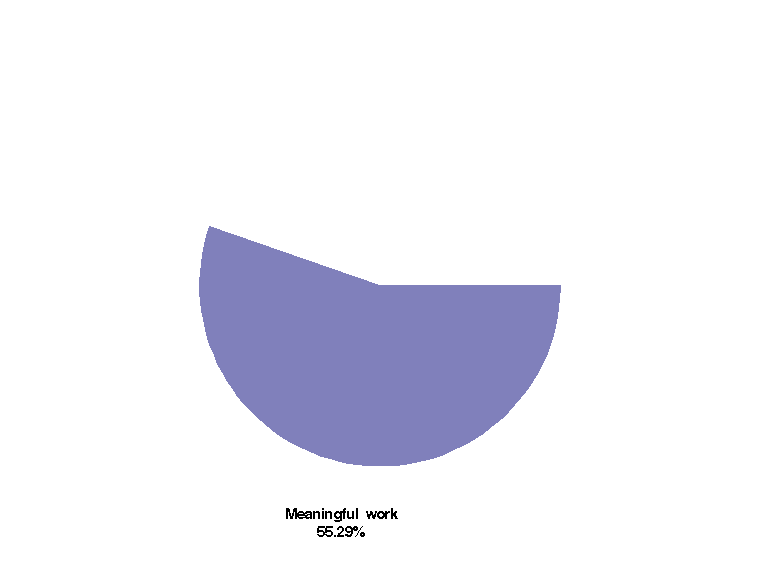
This sample produces an animated pie chart using the GIFANIM device driver.
| Type: | Sample |
| Topic: | Query and Reporting ==> Creating Reports ==> Graphical ==> Graph Types ==> Charts ==> Pie
Third Party ==> Output ==> Device Drivers ==> GIFANIM
|
| Date Modified: | 2005-10-07 03:03:02 |
| Date Created: | 2005-03-07 10:48:00 |
Operating System and Release Information
| SAS System | SAS/GRAPH | All | n/a | n/a |


