Usage Note 25022: Van Elteren test for nonparametric two-way analysis
 |  |  |  |  |
Lehmann (1975) and Dmitrienko et. al. (2005) discuss and illustrate a nonparametric test proposed by van Elteren (1960) for stratified or blocked continuous response data. This test is an extension of Wilcoxon's rank-sum test and is also a Mantel-Haenszel mean score test. As such, it can be obtained using either PROC FREQ or, beginning in SAS® 9.4 TS1M3, PROC NPAR1WAY. It tests the null hypothesis of no treatment effect in the strata. Validity of the test depends only on large overall sample size and not on the strata sizes. Also, normality of the response distribution is not required, so this test can be used when a two-way analysis of variance might not be valid.
The following example from Dmitrienko et. al. (2005) tests for drug effect in a data set from a clinical trial on urinary incontinence with patients from three strata. The response is the percent change from baseline in the number of incontinence episodes per week. Because the distribution of this response is skewed and therefore not considered to be approximately normal, a nonparametric test is preferred.
These statements create the data set of patient responses.
      data urininc;
        input Therapy $ Stratum @@;
        do i=1 to 10;
          input change @@;
          if (change ne .) then output;
        end;
        drop i;
        datalines;
      Placebo 1 -86 -38 43 -100 289 0 -78 38 -80 -25
      Placebo 1 -100 -100 -50 25 -100 -100 -67 0 400 -100
      Placebo 1 -63 -70 -83 -67 -33 0 -13 -100 0 -3
      Placebo 1 -62 -29 -50 -100 0 -100 -60 -40 -44 -14
      Placebo 2 -36 -77 -6 -85 29 -17 -53 18 -62 -93
      Placebo 2 64 -29 100 31 -6 -100 -30 11 -52 -55
      Placebo 2 -100 -82 -85 -36 -75 -8 -75 -42 122 -30
      Placebo 2 22 -82 . . . . . . . .
      Placebo 3 12 -68 -100 95 -43 -17 -87 -66 -8 64
      Placebo 3 61 -41 -73 -42 -32 12 -69 81 0 87
      Drug 1 50 -100 -80 -57 -44 340 -100 -100 -25 -74
      Drug 1 0 43 -100 -100 -100 -100 -63 -100 -100 -100
      Drug 1 -100 -100 0 -100 -50 0 0 -83 369 -50
      Drug 1 -33 -50 -33 -67 25 390 -50 0 -100 .
      Drug 2 -93 -55 -73 -25 31 8 -92 -91 -89 -67
      Drug 2 -25 -61 -47 -75 -94 -100 -69 -92 -100 -35
      Drug 2 -100 -82 -31 -29 -100 -14 -55 31 -40 -100
      Drug 2 -82 131 -60 . . . . . . .
      Drug 3 -17 -13 -55 -85 -68 -87 -42 36 -44 -98
      Drug 3 -75 -35 7 -57 -92 -78 -69 -21 -14 .
      ;
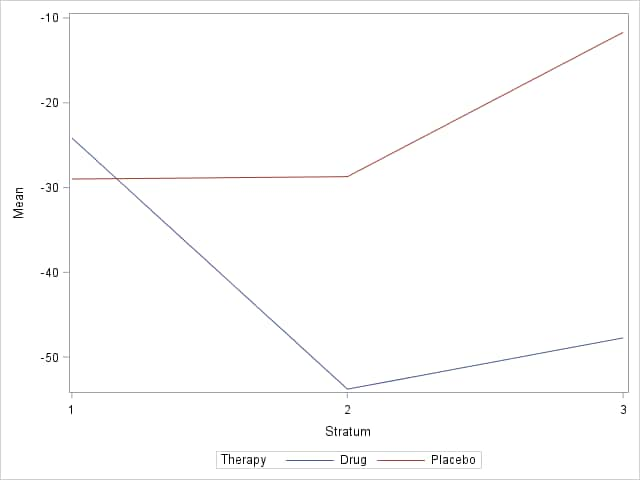
These statements compute the mean percent change for drug and placebo in each stratum and display them in a plot.
      proc means data=urininc mean nway;
        class stratum therapy;
        var change;
        output out=mns mean=Mean;
        run;
      proc sgplot data=mns;
        series y=Mean x=Stratum / group=Therapy;
        xaxis type=discrete;
        run;
The means show a larger decrease in the number of episodes under the drug than with placebo in two of the strata.
 |
||||||||||||||||||||||||||||||||
The van Elteren test for drug effect can be performed using the STRATA statement in PROC NPAR1WAY. Both one-sided and two-sided p-values are provided.
      proc npar1way data=urininc;
        strata stratum;
        class therapy;
        var change;
        run;
The two-sided result (p=0.0122) indicates that the percent change under the drug differs significantly from placebo. If the experimenter initially hypothesized that the drug would produce a greater decrease in episodes, this one-sided test would also be significant (p=0.0061).
|
||||||||||||||||||||||||||||||||
The test can also be done in PROC FREQ by defining a stratified, three-way table and using the CMH and SCORES=MODRIDIT options. In the TABLE statement, the variable(s) defining the strata appear first, followed by the treatment variable and finally the response variable. The NOPRINT option is used to prevent the display of each of the treatment by response tables in the various strata.
      proc freq data=urininc;
        table stratum*therapy*change / cmh scores=modridit noprint;
        run;
The van Elteren test is the test comparing the rows (treatments) of the table. This is the second CMH statistic labeled "Row Mean Scores Differ." Only a two-sided test is available. Note that the p-value matches the two-sided p-value from PROC NPAR1WAY.
|
|||||||||||||||||||||||||
References
Dmitrienko, A., Molenberghs, G., Chuang-Stein, C., Offen, W. (2005), Analysis of Clinical Trials Using SAS®: A Practical Guide, Cary, NC: SAS Institute Inc.
Lehmann, E. L. (1975). Nonparametrics: Statistical Methods Based on Ranks, San Francisco: Holden-Day, pp 132-137, 145.
van Elteren, P. H. (1960). "On the combination of independent two-sample tests of Wilcoxon," Bulletin of the International Statistical Institute, 37, 351-361.
Operating System and Release Information
| Product Family | Product | System | SAS Release | |
| Reported | Fixed* | |||
| SAS System | SAS/STAT | All | n/a | n/a |
data a;
  input blocks treatmnt consump @@;
  datalines;
1 1 236  1 2 255
2 1 183  2 2 179  2 2 193
3 1 115  3 1 128  3 2 132
4 1 61  4 1 70  4 1 79  4 2 67  4 2 84  4 2 88
;

proc freq;
  tables blocks * treatmnt * consump / cmh2 scores=modridit noprint;
  run;
Note that Lehmann's presentation of this example shows one-tailed exact and asymptotic (normal) tests. FREQ gives a two-tailed, asymptotic test. Lehmann does a little rounding in his computations and gets a p-value of 0.050. Carrying his computations out to a little more precision yields p=0.0488, and twice this (0.09765) is the two-tailed p-value which agrees with the p-value from the second CMH statistic.
| Type: | Usage Note |
| Priority: | low |
| Topic: | SAS Reference ==> Procedures ==> FREQ Analytics ==> Nonparametric Analysis SAS Reference ==> Procedures ==> NPAR1WAY |
| Date Modified: | 2018-01-04 16:36:23 |
| Date Created: | 2005-01-13 15:03:54 |