Sample 24924: Create a KAGI plot with PROC GPLOT and Annotate
 |  |  |  |  |
This sample uses PROC GPLOT together with the Annotate facility to simulate a KAGI graph. In the graphics output, the variations in line thickness and line color have meaning. Typically used to follow stock prices, this example generates a thicker green line when the price rises and a narrower red line when the price falls.
These sample files and code examples are provided by SAS Institute Inc. "as is" without warranty of any kind, either express or implied, including but not limited to the implied warranties of merchantability and fitness for a particular purpose. Recipients acknowledge and agree that SAS Institute shall not be liable for any damages whatsoever arising out of their use of this material. In addition, SAS Institute will provide no support for the materials contained herein.
This sample uses PROC GPLOT together with the Annotate facility to simulate a KAGI graph. In the graphics output, the variations in line thickness and line color have meaning. Typically used to follow stock prices, this example generates a thicker green line when the price rises and a narrower red line when the price falls.
The graphics output in the Results tab was produced using SAS® 9.2. Submitting the sample code with releases of SAS prior to SAS 9.2 might produce different results.
 /* Set the graphics environment */
goptions reset=all cback=white border htitle=12pt htext=10pt;

 /* Create the sample data set ONE */
data one;
   input Date date9. Open Close;
   datalines;
05aug2002 5 3
06aug2002 3 7
07aug2002 7 9
08aug2002 9 2
09aug2002 2 5
12aug2002 5 8
13aug2002 8 2
14aug2002 2 2
;
run;

 /* Create data set ANNO1, which            */
 /* generates red vertical lines connecting */
 /* OPEN and CLOSE values for each DATE     */
data anno1;
   set one;
   length function color $8;
   function='move'; xsys='2'; ysys='2'; x=date; y=open; output;
   function='draw'; xsys='2'; ysys='2'; x=date; y=close;
      color='red'; output;
run;

 /* Create data set ANNO2, which conditionally      */
 /* generates the thicker green lines and the       */
 /* horizontal lines                                */
data anno2;
   set one;
   retain tempopen tempclos tempdate topen2 tclos2;
   length function color flag $8;
   if close < open then flag='down';
   if close > open then flag='up';
   if close = open then flag='even';

   tempopen=lag(open);
   tempclos=lag(close);
   tempdate=lag(date);
   topen2=lag2(open);
   tclos2=lag2(close);

   if (lag1(flag)='down' and flag='up' and _n_^=1) then do;
      if tempopen < close then do;
         function='move'; xsys='2'; ysys='2'; x=date; y=tempopen; output;
         function='draw'; xsys='2'; ysys='2'; hsys='4'; x=date; y=close;
             color='green'; when='a'; size=5; output;
      end;
      function='move'; xsys='2'; ysys='2'; x=tempdate; y=tempclos; output;
      function='draw'; xsys='2'; ysys='2'; hsys='4'; x=date; y=open;
           color='red'; when='a'; size=1; output;
   end;

   if (lag1(flag)='up' and flag='up' and _n_^=1) then do;
      function='move'; xsys='2'; ysys='2'; x=date; y=tempclos; output;
      function='draw'; xsys='2'; ysys='2'; hsys='4'; x=date; y=close;
          color='green'; when='a'; size=5; output;
      if topen2 > open then color='red'; else color='green';
      if color='red' then size=1; else size=5;
      function='move'; xsys='2'; ysys='2'; x=tempdate; y=tempclos; output;
      function='draw'; xsys='2'; ysys='2'; hsys='4'; x=date; y=open; when='a'; output;
   end;

   if (lag1(flag)='up' and flag='down' and _n_^=1) then do;
      function='move'; xsys='2'; ysys='2'; x=date; y=tempopen; output;
      function='draw'; xsys='2'; ysys='2'; hsys='4'; x=date; y=open;
          color='green'; when='a'; size=5; output;
      function='move'; xsys='2'; ysys='2'; x=tempdate; y=tempclos; output;
      function='draw'; xsys='2'; ysys='2'; hsys='4'; x=date; y=open;
          color='green'; when='a'; size=5; output;
   end;

   if (flag='even' and _n_^=1) then do;
      if topen2 > open then color='red'; else color='green';
      if color='red' then size=1; else size=5;
      function='move'; xsys='2'; ysys='2'; x=tempdate; y=tempclos; output;
      function='draw'; xsys='2'; ysys='2'; hsys='4'; x=date; y=open; when='a'; output;
   end;
run;

 /* Use a SYMBOL statement to suppress the */
 /* interpolation value and line.          */
symbol1 value=none interpol=none color=black repeat=2;

 /* Specify AXIS1 statement assigned to X-axis */
axis1 order=('05aug2002'd to '14aug2002'd by weekday)
      offset=(2,2)pct minor=none;
axis2 minor=none;

 /* Add a title to the graph */
title1 'KAGI Plot';

 /* Create the graph using the ANNO option  */
 /* on the PROC GPLOT statement and the     */
 /* PLOT statement.                         */
proc gplot data=one anno=anno1;
   plot open*date close*date / overlay haxis=axis1
                               vaxis=axis2 anno=anno2;
   format date mmddyy5.;
run;
quit;
These sample files and code examples are provided by SAS Institute Inc. "as is" without warranty of any kind, either express or implied, including but not limited to the implied warranties of merchantability and fitness for a particular purpose. Recipients acknowledge and agree that SAS Institute shall not be liable for any damages whatsoever arising out of their use of this material. In addition, SAS Institute will provide no support for the materials contained herein.
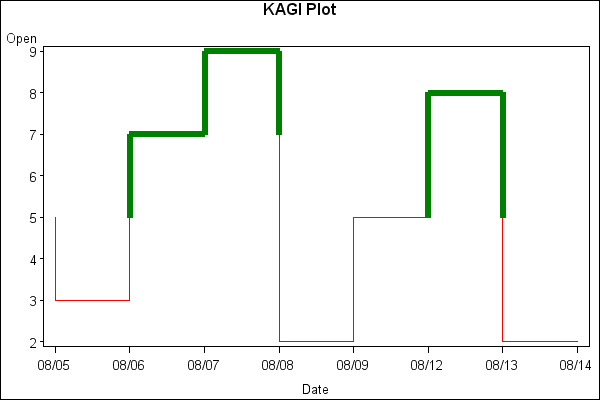
This sample program uses PROC GPLOT with Annotate to simulate a KAGI type chart.
| Type: | Sample |
| Topic: | SAS Reference ==> Procedures ==> GPLOT Query and Reporting ==> Creating Reports ==> Graphical ==> Graph Elements ==> Annotation Query and Reporting ==> Creating Reports ==> Graphical ==> Graph Types ==> Plots ==> Other Plots |
| Date Modified: | 2005-08-31 03:03:18 |
| Date Created: | 2004-11-11 11:08:01 |
Operating System and Release Information
| Product Family | Product | Host | SAS Release | |
| Starting | Ending | |||
| SAS System | SAS/GRAPH | All | n/a | n/a |