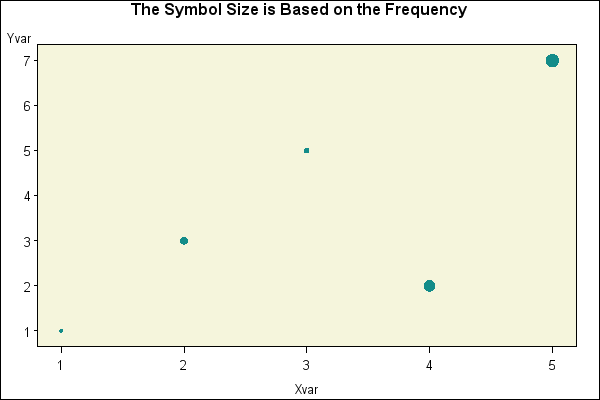
Sample 24919: Use GPLOT to set the symbol size based on the frequency of the data
This program uses PROC FREQ along with PROC GPLOT and the Annotate facility to create a scatter plot where the plot symbols change size based on the frequency of the data. You can also use this method to vary the size, color, and shape of the symbols based on the frequency of other variables.
These sample files and code examples are provided by SAS Institute
Inc. "as is" without warranty of any kind, either express or implied, including
but not limited to the implied warranties of merchantability and fitness for a
particular purpose. Recipients acknowledge and agree that SAS Institute shall
not be liable for any damages whatsoever arising out of their use of this material.
In addition, SAS Institute will provide no support for the materials contained herein.
This program uses PROC FREQ along with PROC GPLOT and the Annotate facility to create a scatter plot where the plot symbols change size based on the frequency of the data.
You can also use this method to vary the size, color, and shape of the symbols based on the frequency of other variables.
The graphics output in the Results tab was produced using SAS® 9.2. Submitting the sample code with releases of SAS prior to SAS 9.2 might produce different results.
 /* Set the graphics environment */
goptions reset=all cback=white border htitle=12pt htext=10pt;

data a;
   input Xvar Yvar;
   datalines;
1 1
2 3
2 3
2 3
3 5
3 5
4 2
4 2
4 2
4 2
4 2
5 7
5 7
5 7
5 7
5 7
5 7
;
run;

 /* Use PROC FREQ to create a new data set */
 /* containing counts for each unique X/Y  */
 /* pair in the original data set.         */
proc freq data=a noprint;
   tables xvar*yvar / out=freqdata;
run;

 /* Create an annotate data set for use with */
 /* PROC GPLOT.  The SIZE variable in the    */
 /* Annotate data set is set using the COUNT */
 /* variable calculated by PROC FREQ.        */
data anno;
   retain xsys ysys '2' hsys '3' when 'a'
          color 'vibg' text 'dot' function 'symbol';
   set freqdata;
   x=xvar;
   y=yvar;
   size=count;
run;

 /* This symbol statement is used to make sure  */
 /* that no symbols or interpolation lines are  */
 /* produced with PROC GPLOT.                   */
symbol1 interpol=none value=none color=white repeat=10;

axis1 minor=none offset=(4pct,4pct);
axis2 minor=none offset=(4pct,4pct);

 /* Add a title to the graph */
title1 'The Symbol Size is Based on the Frequency';
footnote1 angle=90 '  ';

 /* Create the graph using the ANNO= option on the */
 /* PLOT statement of GPLOT.                       */
proc gplot data=a;
   plot yvar * xvar / anno=anno cframe=beige
                      vaxis=axis1 haxis=axis2;
run;
quit;
These sample files and code examples are provided by SAS Institute
Inc. "as is" without warranty of any kind, either express or implied, including
but not limited to the implied warranties of merchantability and fitness for a
particular purpose. Recipients acknowledge and agree that SAS Institute shall
not be liable for any damages whatsoever arising out of their use of this material.
In addition, SAS Institute will provide no support for the materials contained herein.
This program uses PROC FREQ along with PROC GPLOT and the Annotate facility to create a scatter plot where the plot symbols change size based on the frequency of the data.
| Type: | Sample |
| Topic: | SAS Reference ==> Procedures ==> GPLOT
Query and Reporting ==> Creating Reports ==> Graphical ==> Graph Elements ==> Annotation
Query and Reporting ==> Creating Reports ==> Graphical ==> Graph Elements ==> Symbols/Interpolation
|
| Date Modified: | 2005-08-31 03:03:16 |
| Date Created: | 2004-11-11 11:08:00 |
Operating System and Release Information
| SAS System | SAS/GRAPH | All | n/a | n/a |


