Sample 24910: Use PROC GPLOT with Annotate to maintain bubble sizes across BY values
This sample uses PROC GPLOT with the Annotate facility to maintain bubble sizes across BY values.
These sample files and code examples are provided by SAS Institute
Inc. "as is" without warranty of any kind, either express or implied, including
but not limited to the implied warranties of merchantability and fitness for a
particular purpose. Recipients acknowledge and agree that SAS Institute shall
not be liable for any damages whatsoever arising out of their use of this material.
In addition, SAS Institute will provide no support for the materials contained herein.
This sample uses PROC GPLOT with the Annotate facility to maintain bubble sizes across BY values.
The graphics output in the Results tab was produced using SAS® 9.2. Submitting
the sample code with releases of SAS prior to SAS 9.2 might produce different results.
 /* Set the graphics environment */
goptions reset=all cback=white border
         htitle=13pt htext=11pt
	 ftitle='Albany AMT/bold'
         ftext='Albany AMT';

/* Create a sample data set */
data a;
  input Byvar Xvar Yvar Sizevar;
  datalines;
1 10 10 3
1 20 20 4
1 30 30 5
1 40 40 6
2 50 50 3
2 60 60 4
2 70 70 5
2 80 80 6
2 90 90 7
2 100 100 8
2 110 110 9
2 120 120 10
;
run;

 /* Create the Annotate data set.   	*/
 /* HSYS='1' tells Annotate to use the  */
 /* SIZE unit of percent of plot area. 	*/
data anno;
  length function text color $ 8 style $ 25;
  retain xsys ysys '2' hsys '1' when 'a' ;
  set a;
  by byvar;
  function='symbol';
  x=xvar; y=yvar; color='libg';
  size=sizevar; text='dot'; output;

  function='label'; position='1'; style="'Albany AMT/bold'";
  text=put(sizevar,3.); size=5; color='black'; output;
run;

 /* Create symbol definition */
symbol i=none v=none c=white r=10;

 /* Create axes definitions */
axis1 minor=none offset=(2,2);
axis2 minor=none offset=(3,3);

 /* Add a title to the graph */

title1 'Maintain Bubble Size Across By Values';
footnote1 angle=90 '   ';

 /* Create the graph using the ANNO= */
 /* option on the PLOT statement     */
proc gplot data=a;
  by byvar;
  plot yvar*xvar / anno=anno vaxis=axis1 haxis=axis2;
run;
quit;
These sample files and code examples are provided by SAS Institute
Inc. "as is" without warranty of any kind, either express or implied, including
but not limited to the implied warranties of merchantability and fitness for a
particular purpose. Recipients acknowledge and agree that SAS Institute shall
not be liable for any damages whatsoever arising out of their use of this material.
In addition, SAS Institute will provide no support for the materials contained herein.
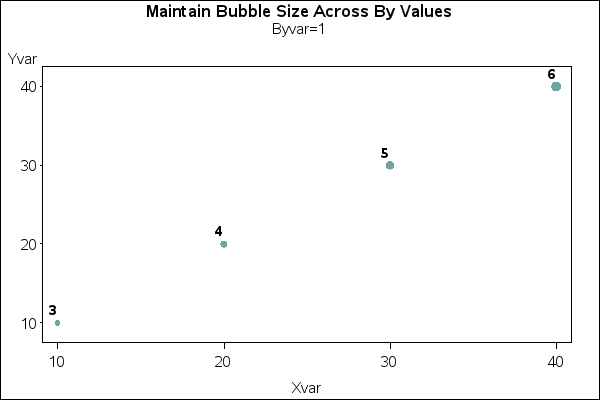
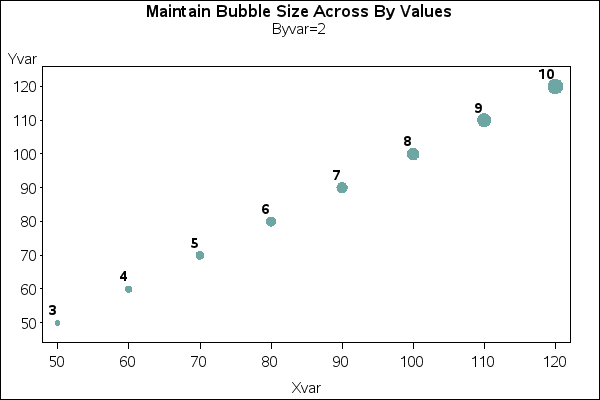
This sample uses PROC GPLOT with the Annotate facility to maintain bubble sizes across BY values.
| Type: | Sample |
| Topic: | SAS Reference ==> Procedures ==> GPLOT
Query and Reporting ==> Creating Reports ==> Graphical ==> Graph Elements ==> Annotation
Query and Reporting ==> Creating Reports ==> Graphical ==> Graph Types ==> Plots ==> Bubble
|
| Date Modified: | 2005-08-31 03:03:11 |
| Date Created: | 2004-11-11 11:07:59 |
Operating System and Release Information
| SAS System | SAS/GRAPH | All | n/a | n/a |


