Sample 24905: Use PROC GMAP to combine United States and Canadian Provinces together
 |  |  |  |  |
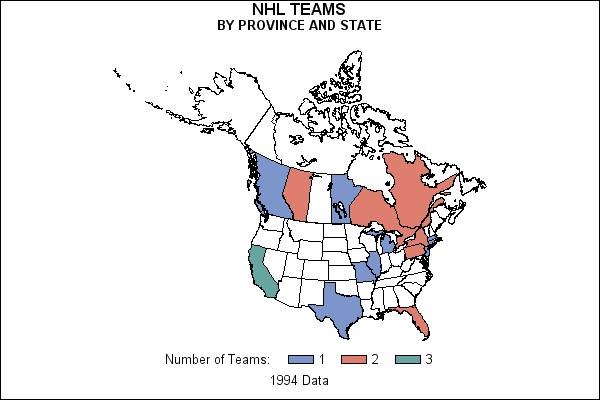
This sample program uses PROC GMAP to create a combined map of Canada and the US.
These sample files and code examples are provided by SAS Institute Inc. "as is" without warranty of any kind, either express or implied, including but not limited to the implied warranties of merchantability and fitness for a particular purpose. Recipients acknowledge and agree that SAS Institute shall not be liable for any damages whatsoever arising out of their use of this material. In addition, SAS Institute will provide no support for the materials contained herein.
This sample program uses PROC GMAP to create a combined map of Canada and the US.
The graphics output in the Results tab was produced using SAS® 9.2. Submitting the sample code with releases of SAS prior to SAS 9.2 might produce different results.
 /* Set the graphics environment */
goptions reset=all cback=white border htitle=12pt htext=10pt;

 /* Create the input data set CANTEAMS for the number of  */
 /* teams in each Canadian province.                      */
data canteams;
   input Province $2. Teams;
   datalines;
24 2    /* Quebec           */
35 2    /* Ontario          */
46 1    /* Manitoba         */
48 2    /* Alberta          */
59 1    /* British Columbia */
;
run;

 /* Create the input data set USTEAMS for the number of  */
 /* teams in each US state.                              */
data usteams;
   input Staten $2. Teams;
   datalines;
CA 3
CT 1
DC 1
FL 2
IL 1
MA 1
MI 1
MO 1
NJ 1
NY 2
PA 2
TX 1
;
run;

 /* Create the input data set, ALLTEAMS, from  */
 /* the two response data sets.                */
 /* Since we need one identification variable, */
 /* we need to put the province and the state  */
 /* values into one variable, STATEN.  The     */
 /* state postal codes are used for the US     */
 /* instead of the FIPS codes so they won't    */
 /* interfere with the province codes.         */
data allteams;

  /* Rename the PROVINCE variable to be STATEN */
  set canteams(rename=(province=staten)) usteams;
run;

 /* Create the input data set, MAPALL, by          */
 /* combining the CANADA4 and STATES map data sets.*/
 /* Create a common identification variable for    */
 /* the combined map data set from the province    */
 /* code and the state code.                       */

data mapall(drop=state province);
  set maps.canada4(in=incan)
  maps.states(where=(state not in(15 72))); /* Remove Hawaii and Puerto Rico */

  /* Assign the province code */
  if incan then staten=province;

  /* Assign the state postal code to the ID variable */
  else staten=fipstate(state);
run;

 /* Project the combined map using the Gnomonic projection with the  */
 /* POLELONG= option to center the new map near the middle of        */
 /* the United States and Canada.                                    */
proc gproject data=mapall out=projmap project=gnomon polelong=100;
   id staten;
run;
quit;

/* Add titles and a footnote to the map */

title1 'NHL TEAMS';
title2 h=10pt 'BY PROVINCE AND STATE';
footnote1  '1994 Data';
footnote2 ' ';

 /* Modify the appearance of the legend */
legend1 label=('Number of Teams:') down=1;

 /* Generate a map of Canada and the US showing NHL teams */
proc gmap data=allteams map=projmap all;
   id staten;
   choro teams / discrete coutline=black legend=legend1;
run;
quit;
These sample files and code examples are provided by SAS Institute Inc. "as is" without warranty of any kind, either express or implied, including but not limited to the implied warranties of merchantability and fitness for a particular purpose. Recipients acknowledge and agree that SAS Institute shall not be liable for any damages whatsoever arising out of their use of this material. In addition, SAS Institute will provide no support for the materials contained herein.
This sample program uses PROC GMAP to create a combined map of Canada and the US.
| Type: | Sample |
| Topic: | SAS Reference ==> Procedures ==> GMAP |
| Date Modified: | 2006-08-24 03:02:52 |
| Date Created: | 2004-11-11 11:07:58 |
Operating System and Release Information
| Product Family | Product | Host | SAS Release | |
| Starting | Ending | |||
| SAS System | SAS/GRAPH | All | n/a | n/a |